SlideSwift
By Category
💼Business 📊Infographics □Minimal 🕐Timelines ✨Neumorphic 🗑Diagrams 🔄Flow Charts ✨Glassmorphism 🎨Creative 🌍Abstract 🔄Cycle Diagrams 💎Isometric 🖼Illustrations 📱Social Media 🗺MapsBy Slide Type
🚀Pitch Deck 📌Roadmap 🔍SWOT Analysis 📅Timeline 📈Gantt Chart 🏢Org Chart 📋Funnel ⚖Comparison 📄Case Study 📋Agenda ⭐Icons & Lists 👏Thank You
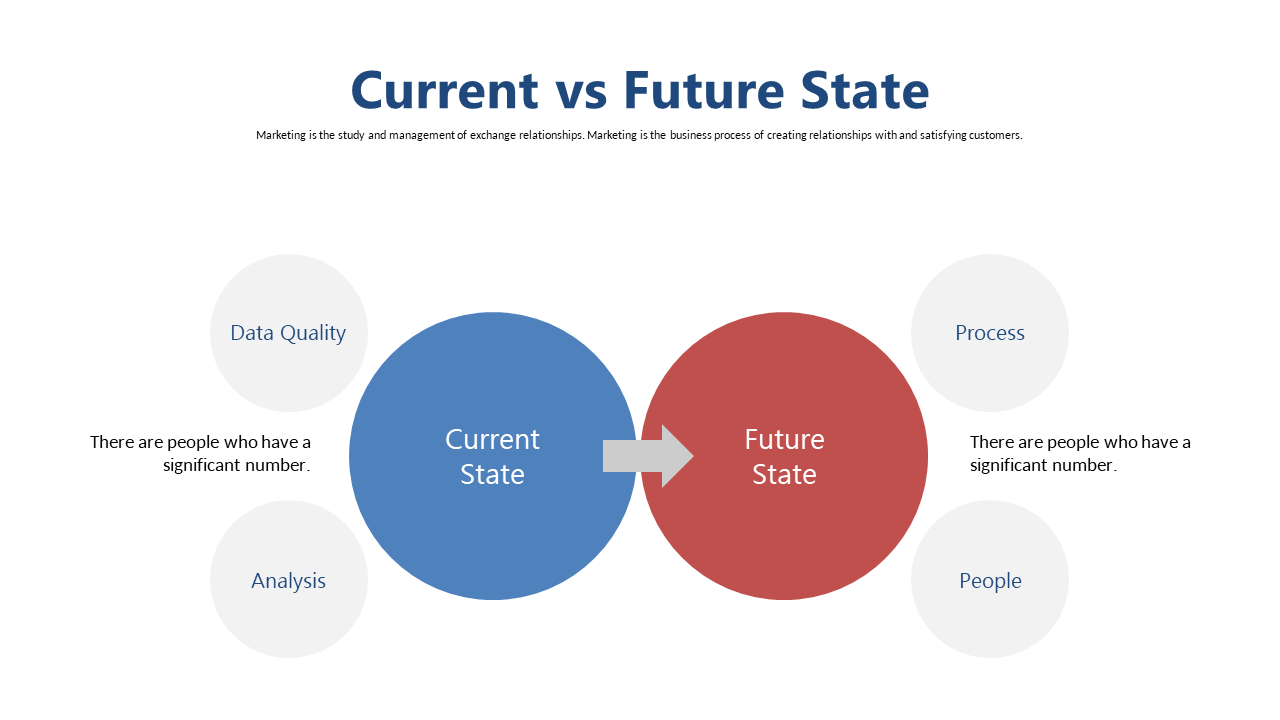
In today’s fast-paced environment, clearly illustrating the differences between where you are and where you want to be is crucial. This slide helps you visualize current versus future states using engaging circular sections that draw attention to key elements. Picture a clean design where each circular section delineates your current state on one side and the future state on the other, making complex shifts understandable at a glance. A sales lead can utilize this slide to present growth strategies during client meetings, ensuring everyone is aligned on objectives. A strategy manager can leverage the clear comparison to facilitate discussions around upcoming initiatives, highlighting the necessary changes for success. An analyst can use this visual to summarize key findings in reports, illustrating the data shifts in a compelling way. Feel free to customize colors and text to match your brand and messaging. $0.99 — add this single slide to any deck from the SlideSwift Slide Library. No subscription needed. Mix slides from any category to build your perfect deck.
Add more from this category to your custom deck