Effective Current vs Future State Comparison
Product Description
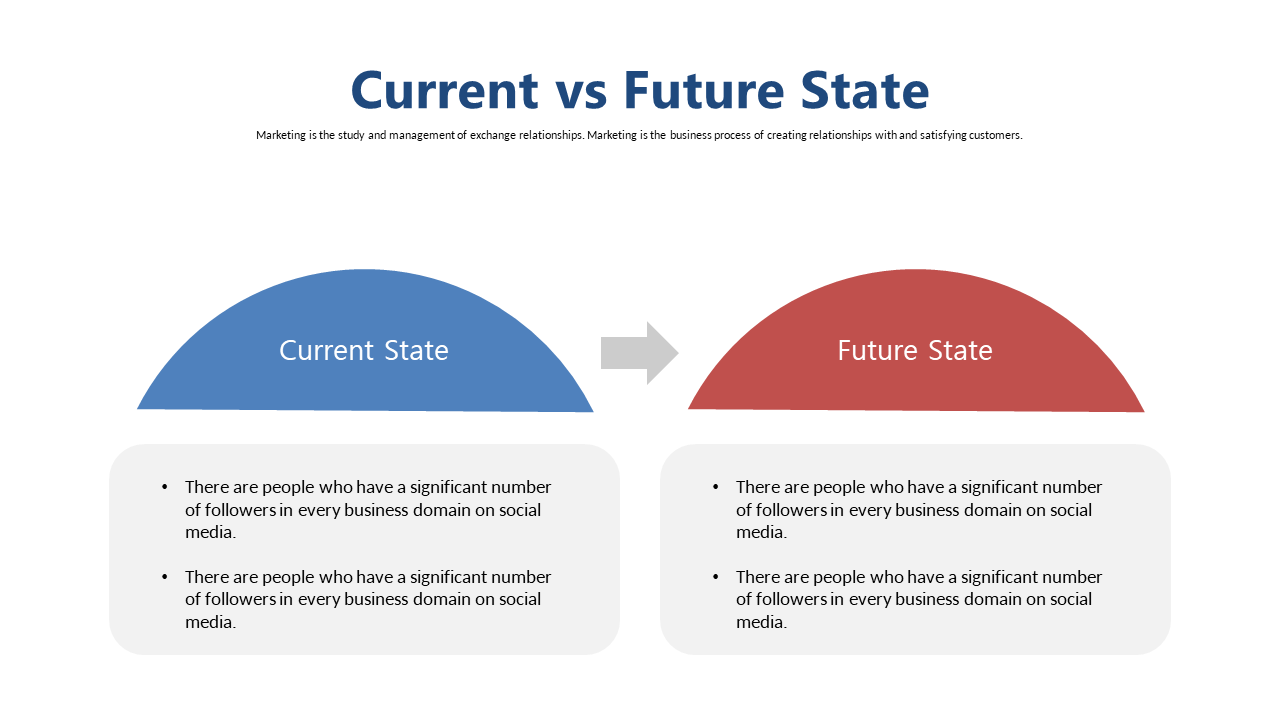
Communicating the transition from a current state to a future state can feel like navigating a complex maze. Without a clear way to visualize this journey, stakeholders might struggle to grasp the necessary steps for change, leading to confusion and misalignment. This slide takes the guesswork out of the equation with bold arrows that guide the audience through the progression effectively.
Consultants, project managers, and team leaders will find this slide particularly useful during strategy meetings and project kickoff sessions. When you need to present a clear path for improvement or transformation, this visual aid helps you articulate your points with precision to clients or team members.
Anyone in sectors like business development or organizational change will benefit from its clarity. For just $0.99, you can instantly download this slide and start customizing it in PowerPoint or Google Slides. Editing is a breeze, allowing you to tailor the content to fit your specific needs in just minutes.
$0.99 – Purchase Checkout
Added to cart







