SlideSwift
By Category
💼Business 📊Infographics □Minimal 🕐Timelines ✨Neumorphic 🗑Diagrams 🔄Flow Charts ✨Glassmorphism 🎨Creative 🌍Abstract 🔄Cycle Diagrams 💎Isometric 🖼Illustrations 📱Social Media 🗺MapsBy Slide Type
🚀Pitch Deck 📌Roadmap 🔍SWOT Analysis 📅Timeline 📈Gantt Chart 🏢Org Chart 📋Funnel ⚖Comparison 📄Case Study 📋Agenda ⭐Icons & Lists 👏Thank You
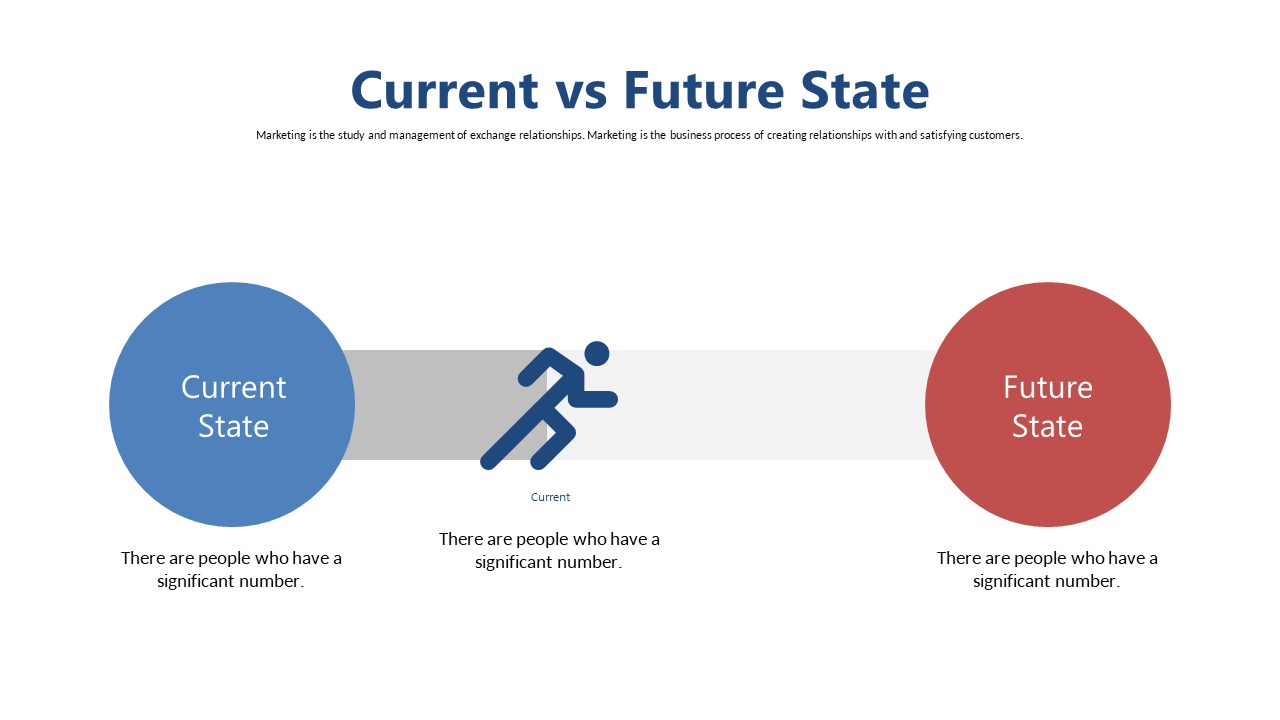
When you’re tasked with presenting complex information, clarity is key. The Engaging Current vs Future State Comparison Diagram helps you illustrate changes and progress effectively. This slide uses vibrant colors and an eye-catching icon to differentiate between the current and future states, making it easy for your audience to grasp the implications at a glance. As an analyst, you can use this slide to showcase data trends and projections with precision. For consultants, it serves as a powerful visual tool to convey strategic recommendations to clients, ensuring they understand the benefits of proposed changes. Sales leads can leverage this slide to outline the advantages of their solutions over competitors, highlighting how their offerings can bridge the gap between today’s challenges and future opportunities. Each section of the slide is fully editable, allowing you to tailor it to your specific message. $0.99 — add this single slide to any deck from the SlideSwift Slide Library. No subscription needed. Mix slides from any category to build your perfect deck.
Add more from this category to your custom deck