Visual Comparison of Current and Future States
Product Description
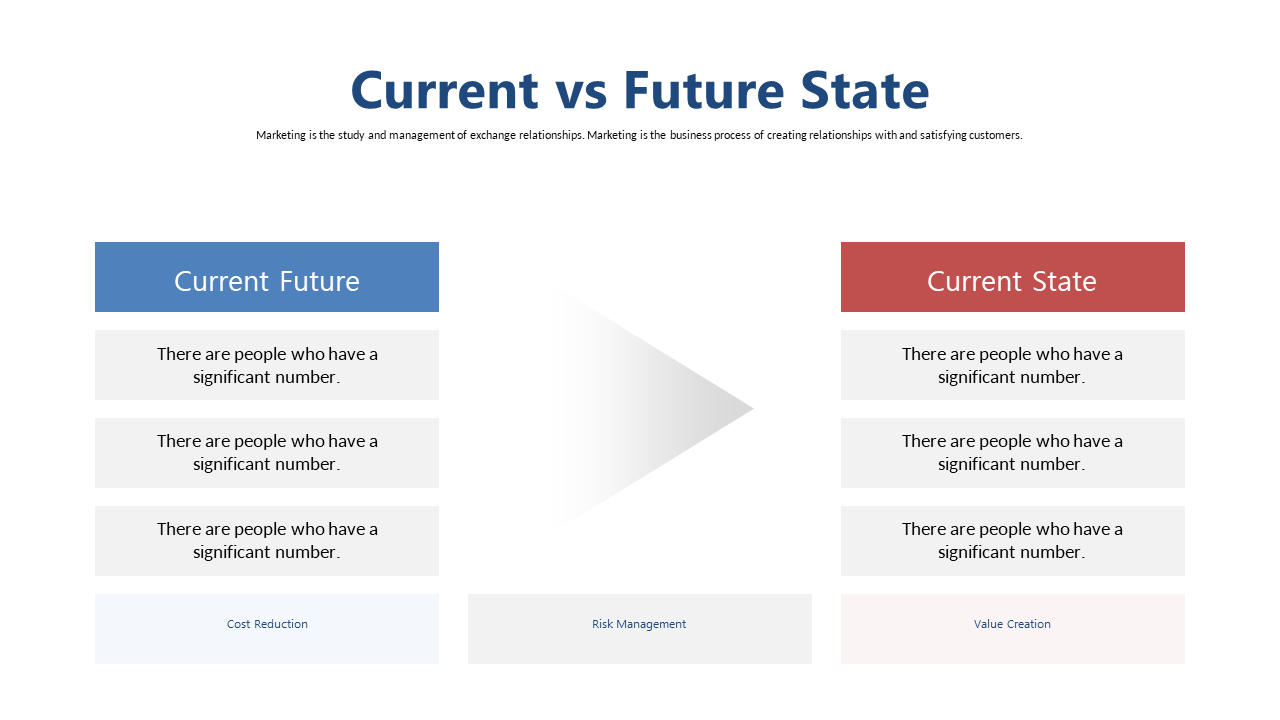
Communicating shifts in strategy can be daunting, especially when your audience grapples with complex information. This slide transforms that challenge into an opportunity by providing a clear visual comparison between the current and future states, guiding your audience through the necessary changes with ease.
Strategy managers, project leads, and consultants across industries like technology and finance will find this slide particularly useful during quarterly business reviews or strategic planning sessions. You can effortlessly illustrate how proposed initiatives will evolve your organization, making it relatable for team members and executives alike.
For just $0.99, you’ll receive an instantly downloadable slide that’s fully editable in PowerPoint and Google Slides. With a user-friendly design, this slide will have you ready to present in minutes.
$0.99 – Purchase Checkout
Added to cart







