Comparison of Transport Modes with Visual Icons
Product Description
Presenting complex comparisons clearly can be a daunting task, especially when information overload can confuse your audience. Striking the right balance with visuals can help simplify your message.
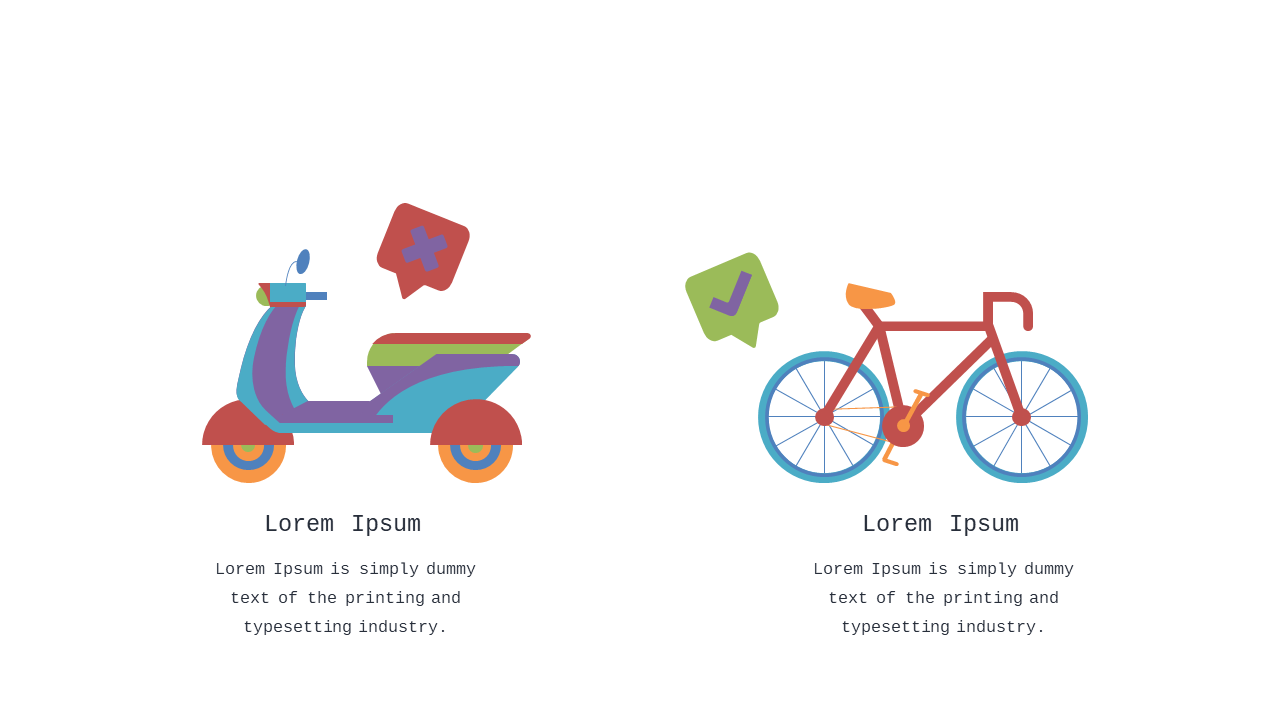
This slide provides a straightforward side-by-side comparison of two transport modes, making it easy to convey critical differences at a glance. You’ll find this slide particularly useful if you’re an analyst in the logistics industry, a business consultant comparing transportation options for clients, or a product manager evaluating different delivery methods. It’s designed for meetings where clarity and visual appeal are essential, whether that’s for internal reviews or client-facing presentations.
At just $0.99, this slide is available for instant download and fully editable in both PowerPoint and Google Slides. Quickly tailor it to meet your needs and present your information clearly within minutes.
$0.99 – Purchase Checkout
Added to cart







