Comparison Table for Service Evaluation
Product Description
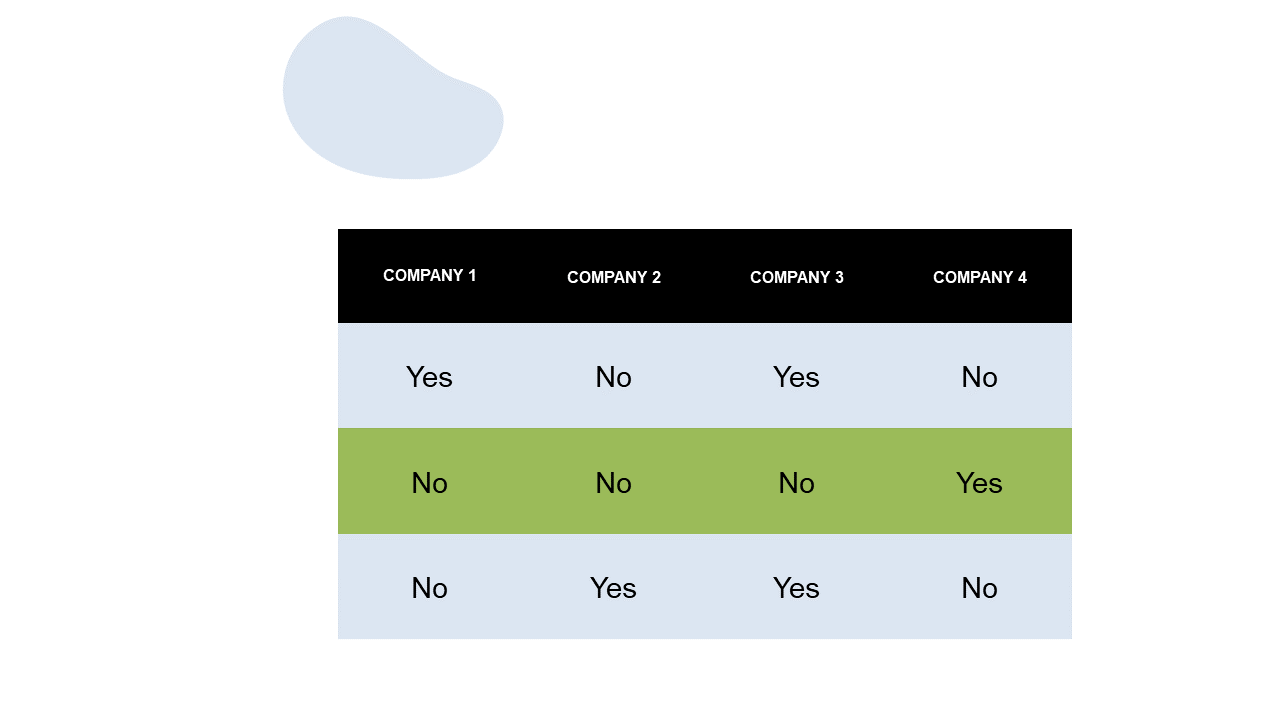
Making decisions about multiple service options can feel overwhelming, especially when clear comparisons are lacking. This comparison table is designed to simplify your evaluations by allowing you to present key features side by side.
By using this slide, you can provide a visual aid that contributes to informed decision-making during discussions. Ideal for project managers and team leaders, this slide can be used in client meetings to evaluate vendor options or in internal discussions to assess service providers. It helps convey important details succinctly, allowing your team or clients to see the differences at a glance without feeling lost in information.
You can grab this slide for just $0.99 and download it instantly for editing in PowerPoint or Google Slides. The straightforward design makes it easy to insert your own data and start making comparisons right away.
$0.99 – Purchase Checkout
Added to cart







