Highlight Product Features with Comparison Infographics
Product Description
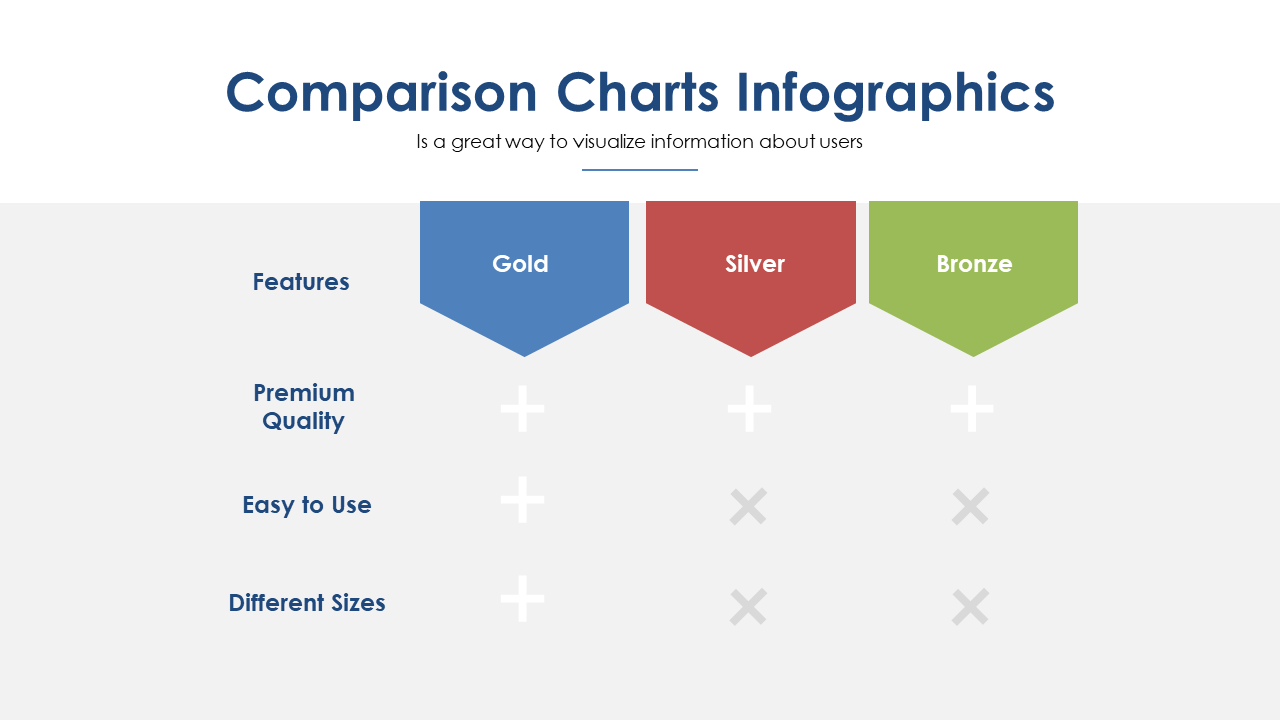
Presenting different product features can sometimes lead to confusion and information overload for your audience. This comparison infographic slide clarifies those features by organizing them in an easy-to-follow layout.
Its structured design ensures that each product tier stands out, allowing your audience to grasp the differences swiftly. Sales professionals, product managers, and marketing specialists will find this slide invaluable when discussing product offerings during sales pitches, team strategy meetings, or customer demos. It’s an excellent tool for any scenario where clarity on product comparisons helps inform decision-making.
For just $0.99, you can download this slide instantly, and it’s fully editable in PowerPoint and Google Slides. Simplifying your product presentations has never been easier.
$0.99 – Purchase Checkout
Added to cart







