Analyze Software Pricing with Comparison Chart
Product Description
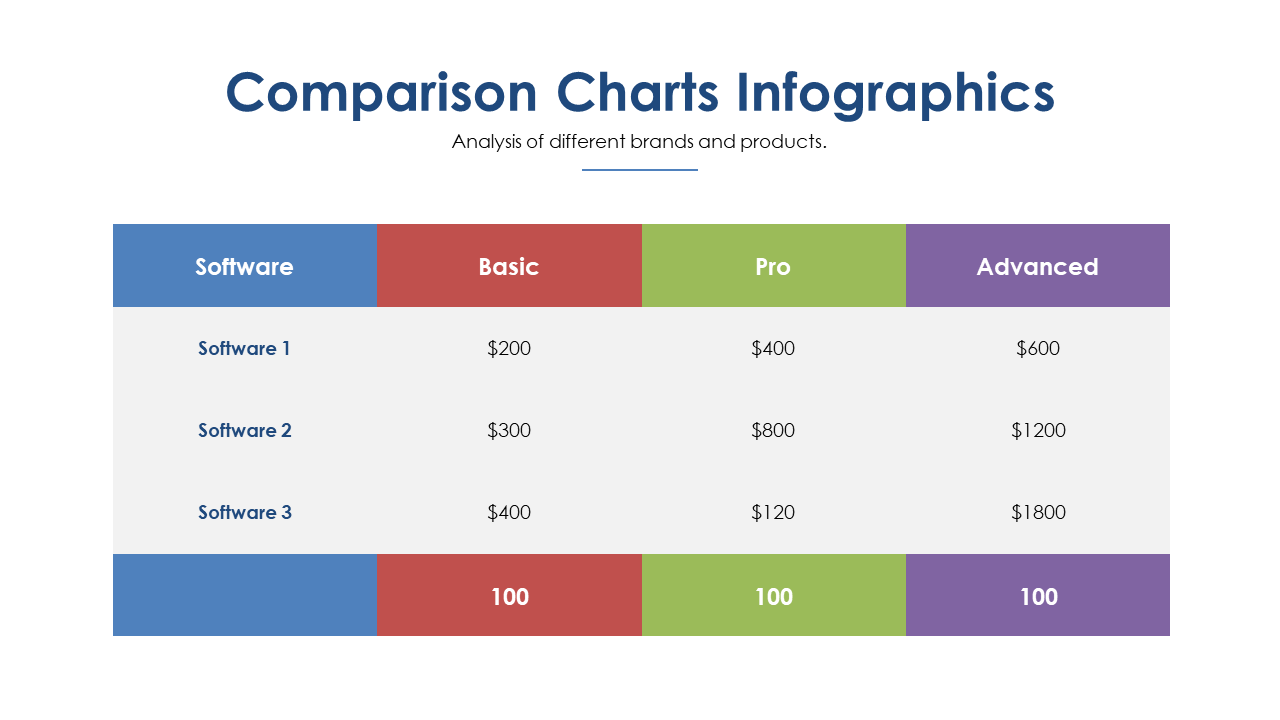
Understanding software pricing can feel overwhelming, especially with multiple options and tiers to compare. This slide simplifies the decision-making process by offering a clear comparison chart that outlines the various software packages and their pricing structures.
It helps you cut through the noise and make informed choices quickly. Ideal for finance teams, IT managers, or procurement specialists who need to compare software costs, this slide is a valuable asset in budget meetings, vendor assessments, or strategic planning sessions. You’ll be able to present pricing in a way that’s straightforward and easy to understand.
For just $0.99, you can download this slide instantly, modify it to fit your needs, and use it in both PowerPoint and Google Slides. With its user-friendly format, you can get your presentation ready in no time.
$0.99 – Purchase Checkout
Added to cart







