Present Strategies with Colorful Vertical Steps
Product Description
Explaining strategies can often lead to confusion if the information isn’t presented clearly. You need a way to communicate your ideas that is both structured and visually engaging.
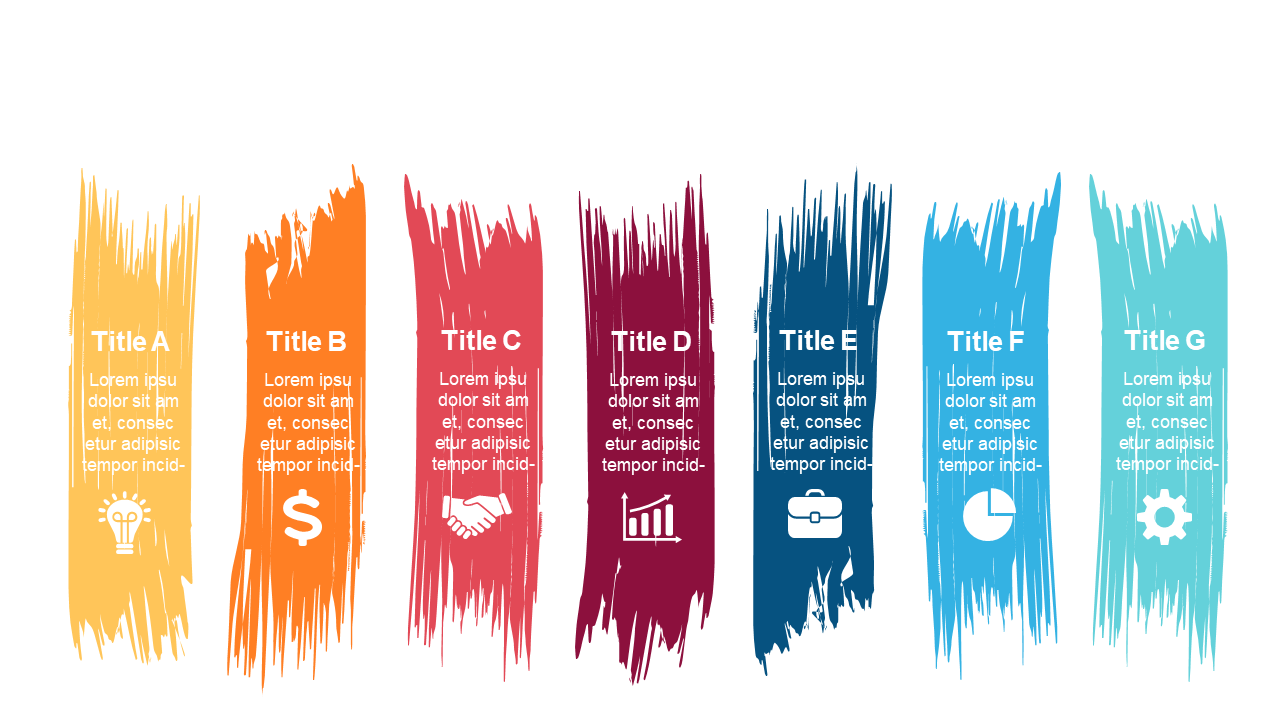
This slide, featuring colorful vertical steps, makes it easy for your audience to follow along and understand your points without getting lost. Project managers outlining action plans, business analysts presenting growth strategies, or team leads discussing performance metrics will find this slide particularly useful. It offers a clear layout that allows you to break down complex strategies into digestible parts, keeping everyone on the same page.
Available for just $0.99, this slide can be downloaded immediately and edited in PowerPoint or Google Slides. You can quickly adapt it to fit your specific needs, ensuring a polished presentation with minimal effort.
$0.99 – Purchase Checkout
Added to cart







