Organize Information with Vertical Steps V3
Product Description
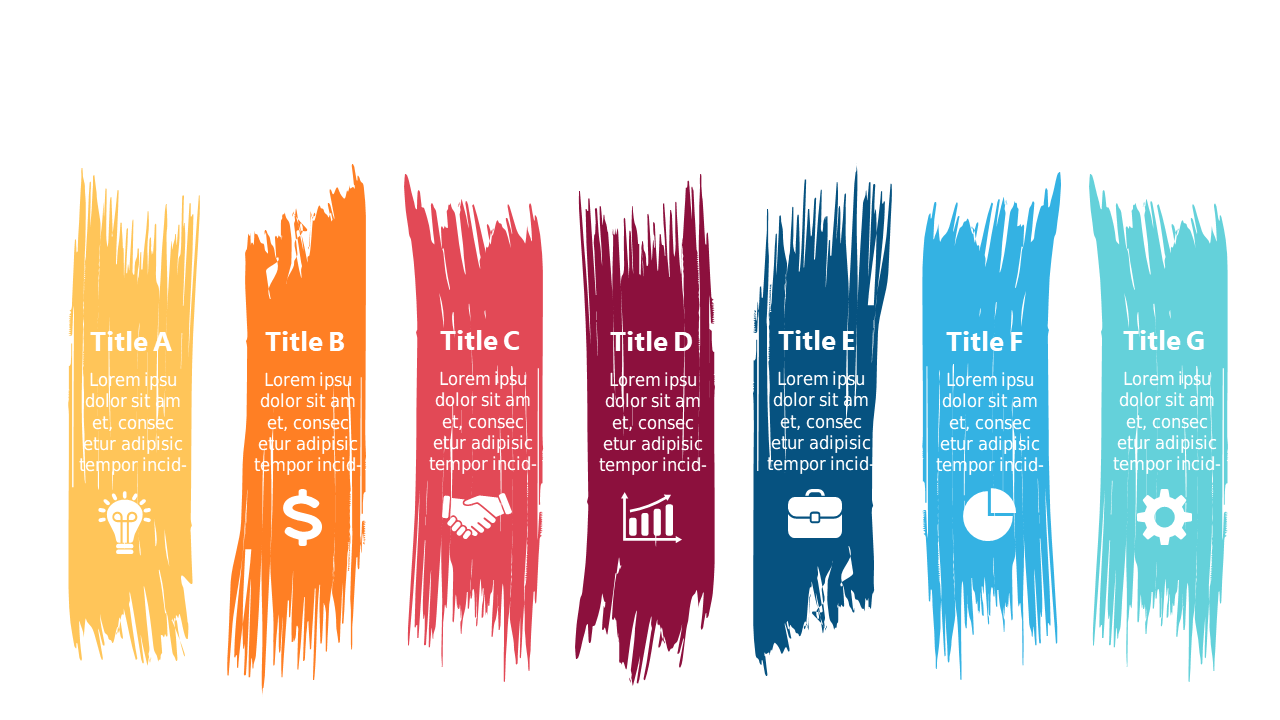
As an analyst, conveying complex data clearly can feel like a daunting task, especially when you’re in front of a group. It’s vital to present your insights in a way that is not only structured but also engaging. This slide features vertical steps adorned with colorful icons, providing a clear path for your audience to follow.
Think about financial analysts summarizing quarterly results, data scientists sharing research findings, or consultants explaining analytics. This slide design helps you break down complex information, allowing your audience to easily understand and engage with your insights.
For just $0.99, you can download this slide right away, fully editable in PowerPoint and Google Slides. In just a few minutes,
you can customize it to suit your needs, ensuring your presentation stands out.
$0.99 – Purchase Checkout
Added to cart