Compare Products with Colorful Trash Can Icons
Product Description
When comparing multiple products, delivering clarity is essential for your audience’s understanding. A visually engaging method to showcase differences can lead to quicker decision-making.
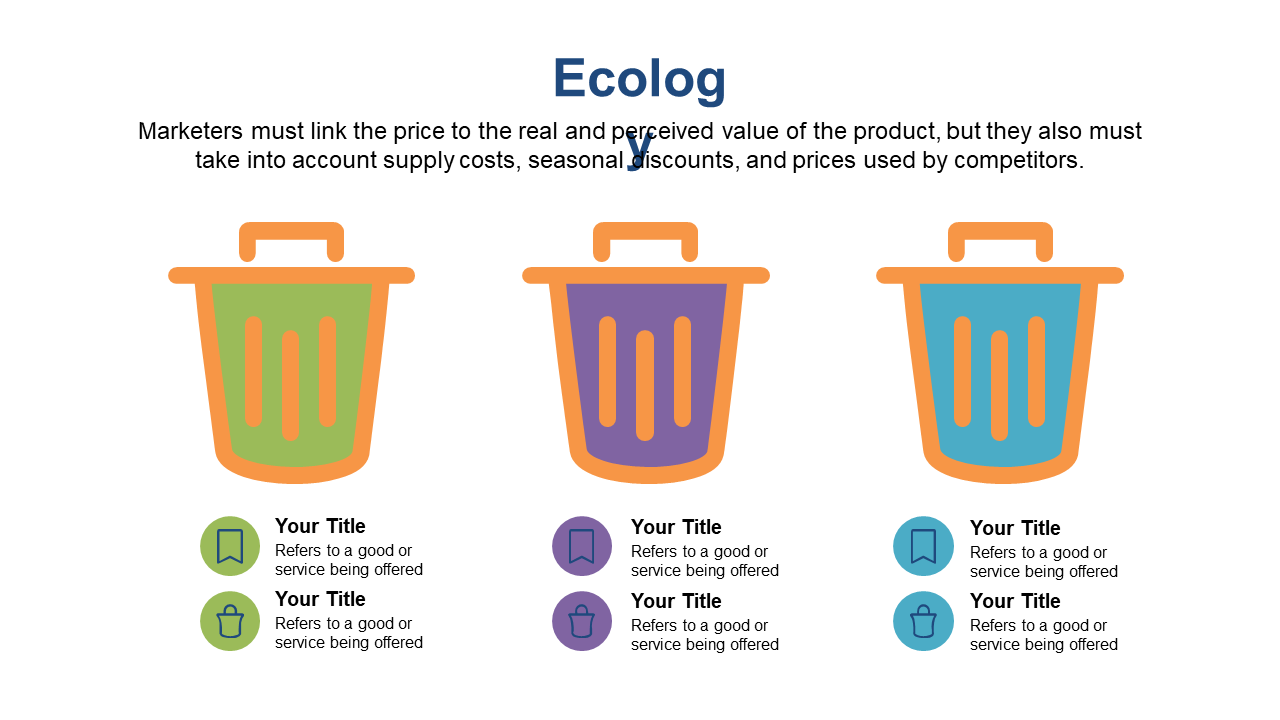
This slide employs colorful trash can icons to help illustrate diverse products or services, making comparisons straightforward. Product managers and sales teams will find this slide particularly useful in product launch presentations, sales pitches, or even internal reviews where comparisons are crucial. It’s designed to grab attention while helping your audience understand key distinctions at a glance.
Available for only $0.99, this slide can be downloaded instantly and is fully editable. You can easily modify it in PowerPoint or Google Slides to tailor it to your specific presentation requirements.
$0.99 – Purchase Checkout
Added to cart







