Visualize Key Events with Virus-Shaped Timeline
Product Description
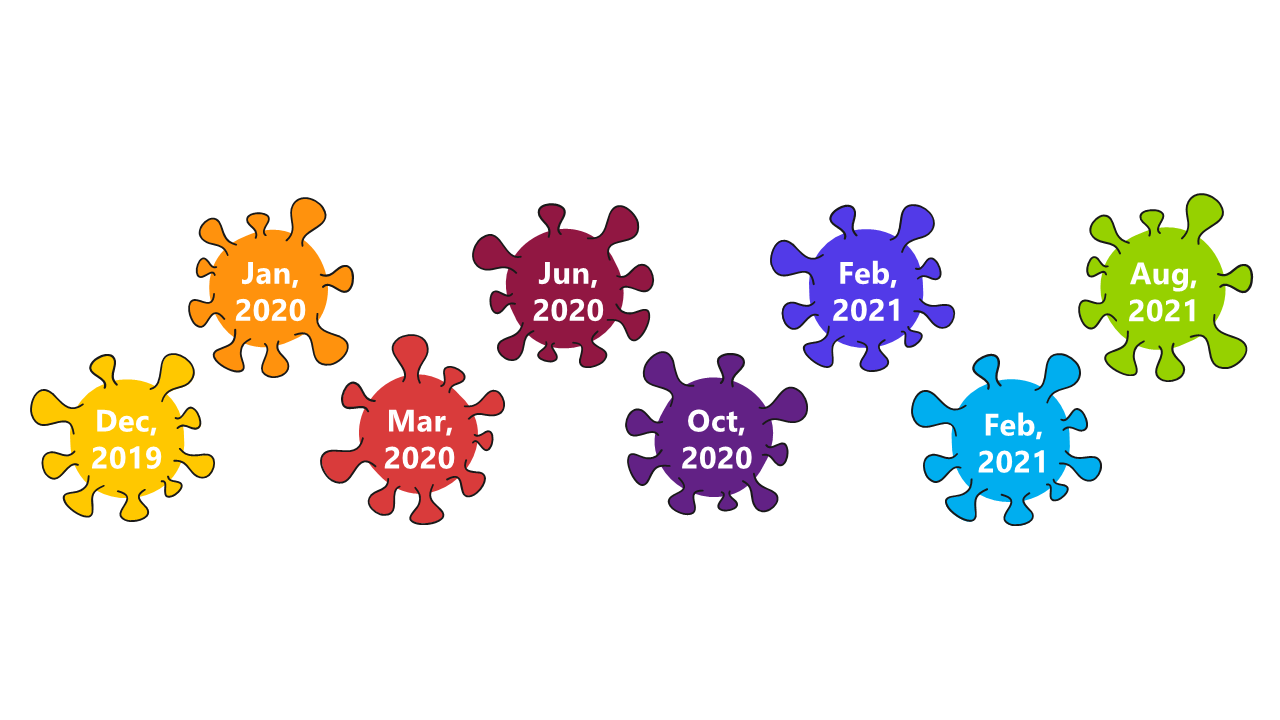
Conveying the timeline of a disease outbreak or key project milestones can be challenging without the right visuals. This slide, featuring colorful virus shapes, provides a compelling way to illustrate these important events and keeps your audience engaged.
Ideal for health professionals discussing the spread of diseases, educators presenting project timelines in health classes, or researchers summarizing significant findings, this template is designed for clarity. Use it to make complex information accessible and memorable.
For just $0.99, you can download this slide instantly and customize it in PowerPoint or Google Slides. With easy editing options for colors and dates, you can tailor it to fit your specific presentation needs quickly.
$0.99 – Purchase Checkout
Added to cart