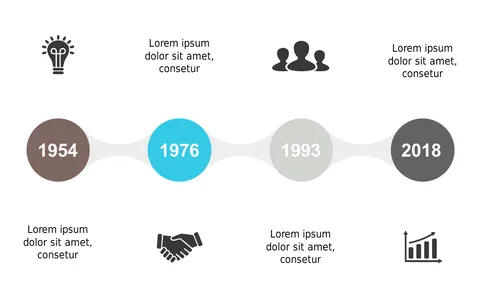
Engage Your Audience with a Colored Circular Timeline

Product Description
Keeping your team informed about project timelines can be tough, especially when you need to engage them with clear visuals. As a program manager, you want to present your milestones in a way that’s not only informative but also visually appealing.
This colored circular timeline slide serves that purpose perfectly, offering a creative way to display your project’s progress while maintaining clarity. This slide works wonders for program managers in software development teams during sprint planning meetings or for construction project leads presenting timelines to contractors and clients. It’s also beneficial for marketing managers looking to visualize campaign timelines during strategic discussions.
For only $0.99, you can download this slide immediately and have it ready for use in no time. The slide is easily editable in both PowerPoint and Google Slides, allowing you to customize it to reflect your project’s unique details and goals.
$0.99 – Purchase Checkout
Added to cart