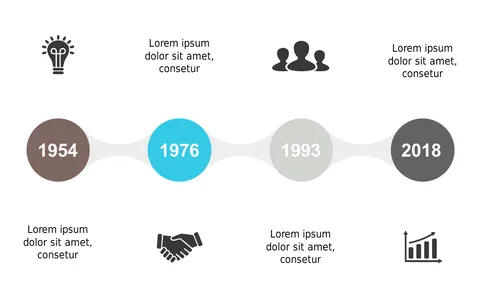
Present Key Milestones with Circular Timeline

Product Description
Keeping the audience engaged while presenting key milestones can often be a struggle. A circular timeline design allows you to present significant events in a visually appealing way, making it easier for your viewers to follow along and understand your project’s journey.
This slide works wonders for project coordinators showcasing project overviews, business analysts tracking product development cycles, or sales teams reporting milestones in client meetings. Its design is versatile and can fit neatly into any industry presentation, capturing attention effectively.
For only $0.99, this slide is ready for immediate download and can be customized in both PowerPoint and Google Slides. Get set to elevate your presentations with a clear and attractive timeline that communicates your progress.
$0.99 – Purchase Checkout
Added to cart