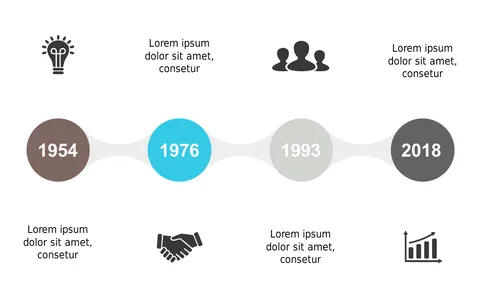
Showcase Progress with Circular Timeline Icons

Product Description
Juggling multiple tasks and timelines can make it hard to present your project’s progress clearly. Overly complicated visuals often cloud your message rather than clarify it.
This slide features a circular timeline design, using distinct icons to highlight key milestones, making your information accessible and engaging. This design is especially beneficial for project managers in healthcare or education, where you need to communicate progress updates during team meetings or presentations to management. It’s also suitable for anyone in event planning who must share updates on milestone achievements in an engaging way.
For just $0.99, you can download this slide instantly and edit it directly in PowerPoint or Google Slides. Customize it to fit your unique project needs quickly, ensuring your audience stays focused and informed.
$0.99 – Purchase Checkout
Added to cart