Compare Options with Circular Progress Indicators
Product Description
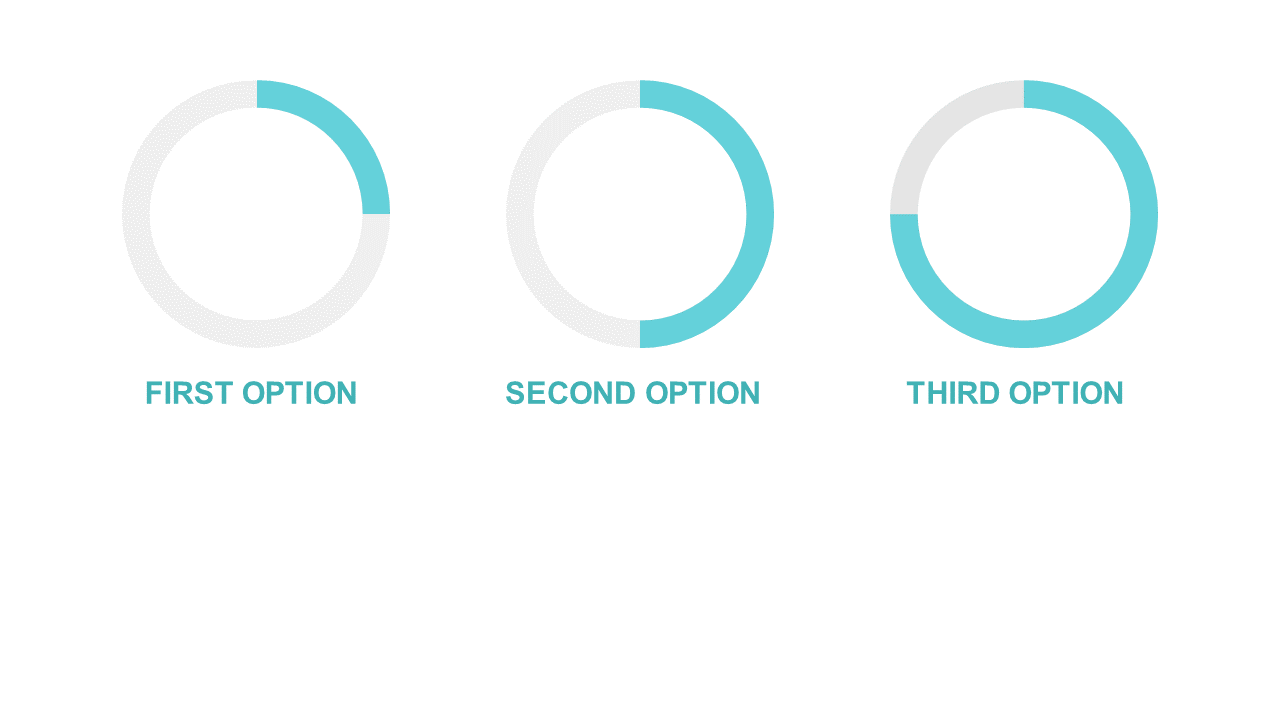
Comparing multiple options can get messy, especially when you want to convey progress visually. This layout with circular progress indicators makes it simple to show how different choices stack up against each other, providing clarity and engagement that standard bullet points just can’t achieve.
Sales teams can use this slide to compare different products or service levels during client meetings, while project managers might employ it to illustrate project milestones. It’s also great for marketing professionals wanting to show campaign effectiveness in a visually appealing way, making it easier for audiences to grasp complex information quickly.
At only $0.99, you’ll get instant access to this editable slide, which
you can customize in both PowerPoint and Google Slides. Make your comparison clear and compelling in no time at all.
$0.99 – Purchase Checkout
Added to cart







