Compare Concepts with Circular Comparison Layout
Product Description
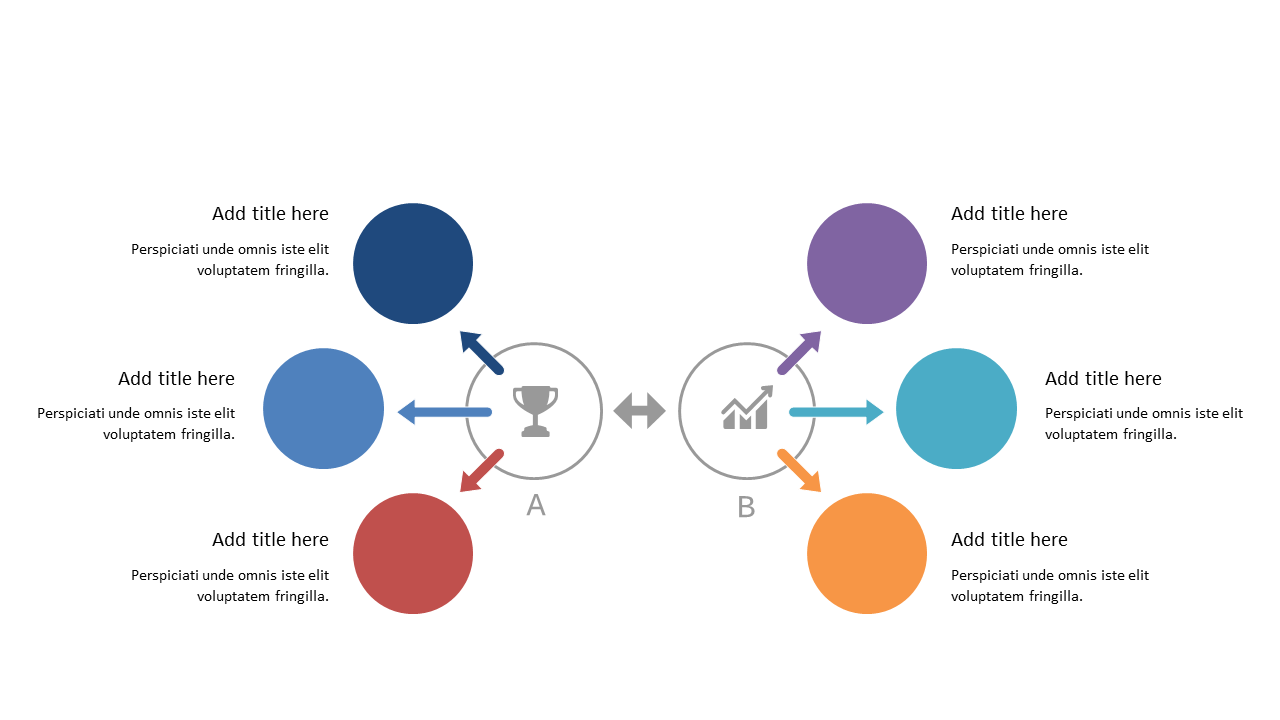
When you need to showcase the differences between two concepts, clarity can often get lost in translation. This slide offers a clean, structured way to visually compare key points at a glance, making it easier for your audience to comprehend contrasting ideas.
The central circular element effectively connects both concepts without overwhelming your viewers. Marketing professionals conducting competitive analyses, financial analysts comparing investment options, or educators discussing opposing viewpoints can greatly benefit from this slide. Use it in team meetings, client presentations, or classroom discussions to ensure everyone walks away with a solid understanding of the comparisons being made.
For only $0.99, you can download this slide and customize it to meet your needs. It’s ready for immediate use in PowerPoint and Google Slides, making it easy to enhance your presentations quickly.
$0.99 – Purchase Checkout
Added to cart







