Compare Options with Circular Design Layout
Product Description
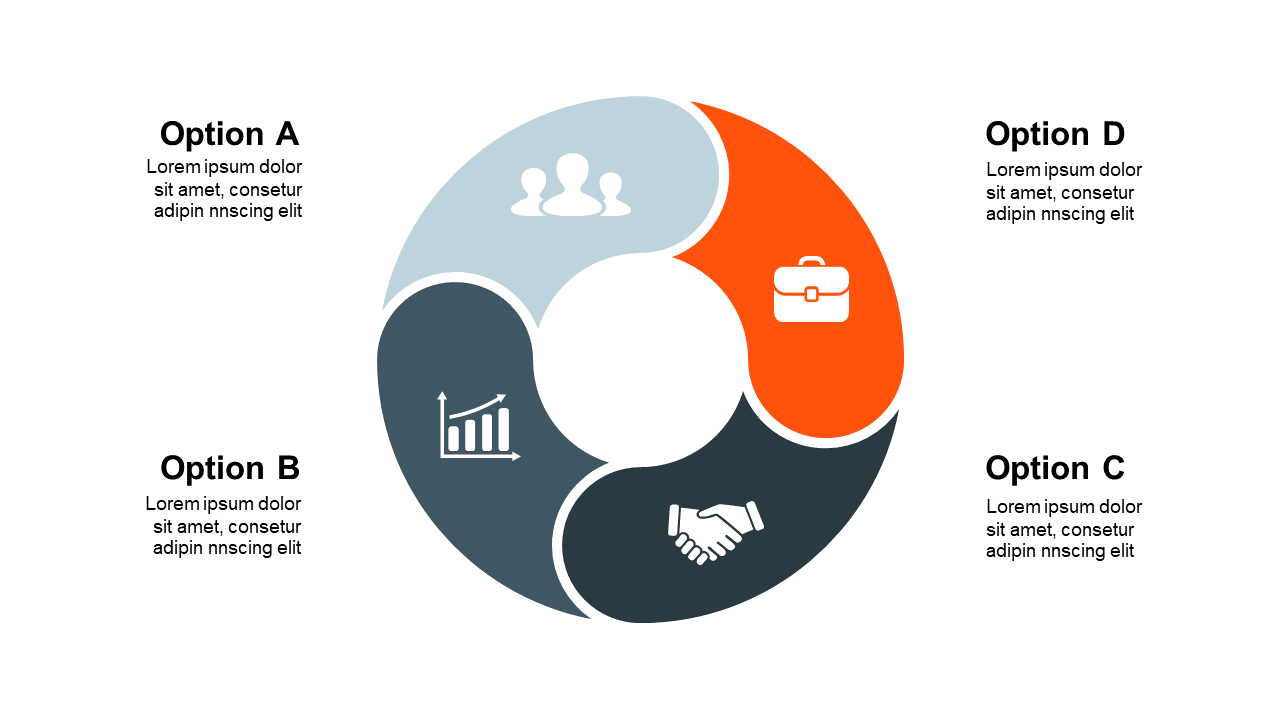
Presenting multiple options can often lead to confusion when key differences aren’t clearly defined. It’s easy for your audience to become overwhelmed with information, and you want them to leave with a clear understanding of each choice. This circular design layout helps you break down and highlight three distinct options, allowing for a more streamlined comparison.
Consider using this slide as a strategy manager during a product selection meeting or when presenting financial investment options to your team. It’s perfect for marketing managers looking to compare campaign strategies or even for sales professionals evaluating different product features.
The clear visual layout ensures that your audience can easily digest the information. For just $0.99, you can instantly download and edit this slide in PowerPoint or Google Slides. It’s designed to fit seamlessly into your presentation so you can focus on delivering your message effectively.
$0.99 – Purchase Checkout
Added to cart







