Compare Brain Lobes Visually
Product Description
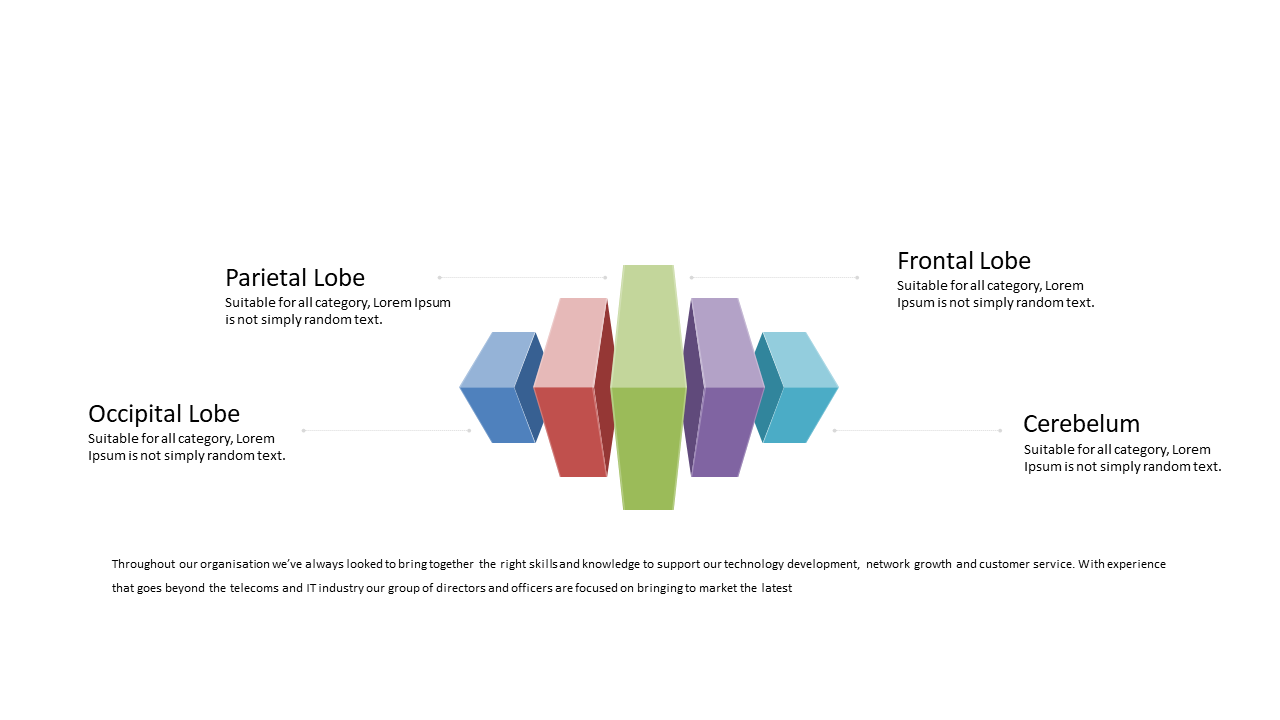
Explaining the complex functions of the brain can be a daunting task, particularly when you’re trying to simplify dense information for your audience. The vibrant visuals on this slide effectively compare different brain lobes, breaking down intricate concepts into digestible pieces.
It’s designed to grab attention and facilitate understanding in a straightforward manner. Healthcare professionals, educators, or researchers discussing neurological studies will find this slide invaluable during lectures, workshops, or client meetings. It’s an excellent resource for anyone aiming to present neuroscientific concepts clearly, helping audiences to connect the dots between structure and function.
At just $0.99, this slide is available for instant download and is easily customizable in PowerPoint and Google Slides. Get ready to enhance your presentations with eye-catching visuals that make complex information easier to grasp.
$0.99 – Purchase Checkout
Added to cart







