Differentiate Options with Central Checkmark Diagram
Product Description
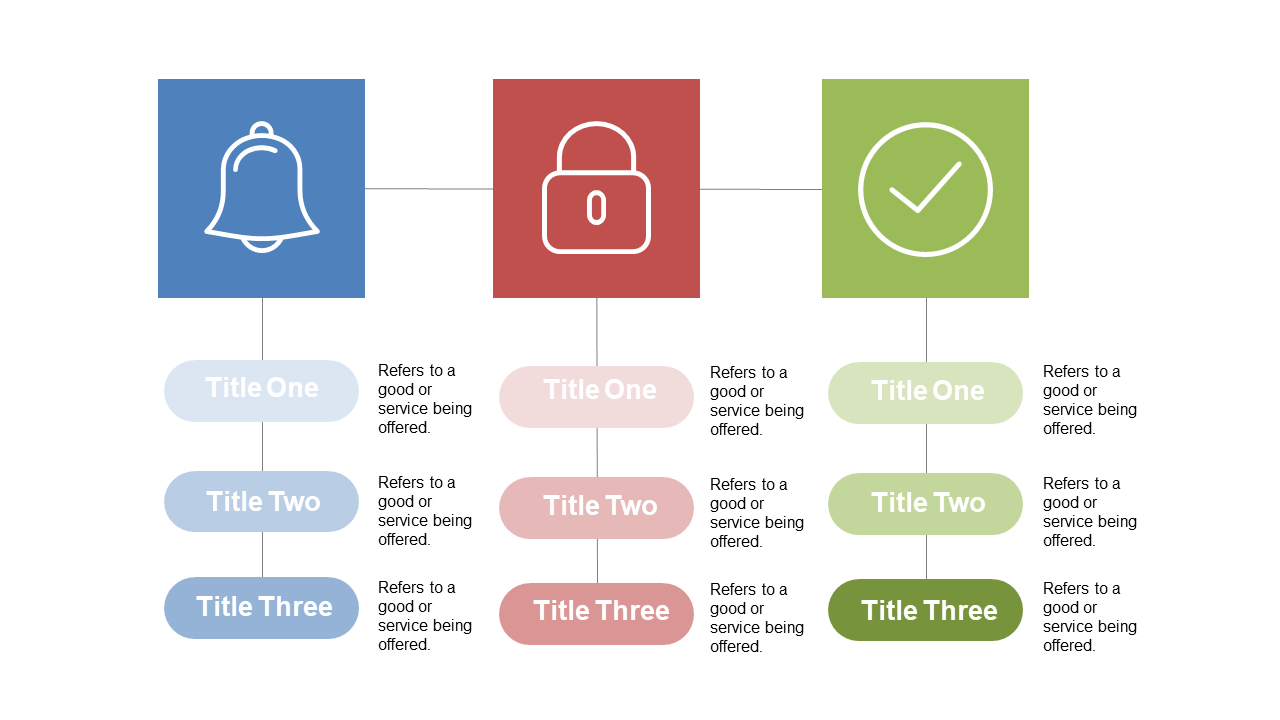
In a world where choices abound, effectively differentiating between options is crucial for your audience’s understanding. This central checkmark diagram clearly divides information into three distinct categories, using visual cues to reflect key features of each option.
It’s a straightforward yet engaging way to facilitate decision-making. Ideal for business analysts presenting findings or project managers evaluating different strategies, this slide can help clarify your message in any meeting where options need to be weighed carefully. Its clear design ensures that your audience can follow along easily.
For just $0.99, you can download this slide instantly and start personalizing it in PowerPoint or Google Slides. Editing is a breeze, allowing you to tailor it to your specific context in just minutes.
$0.99 – Purchase Checkout
Added to cart







