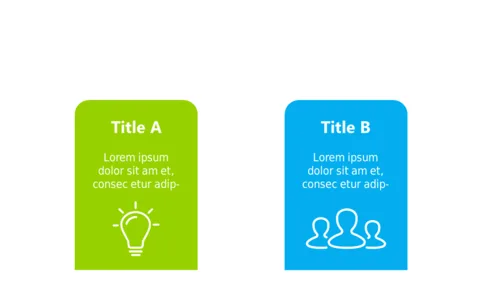
Dual Comparison Layout with Icons
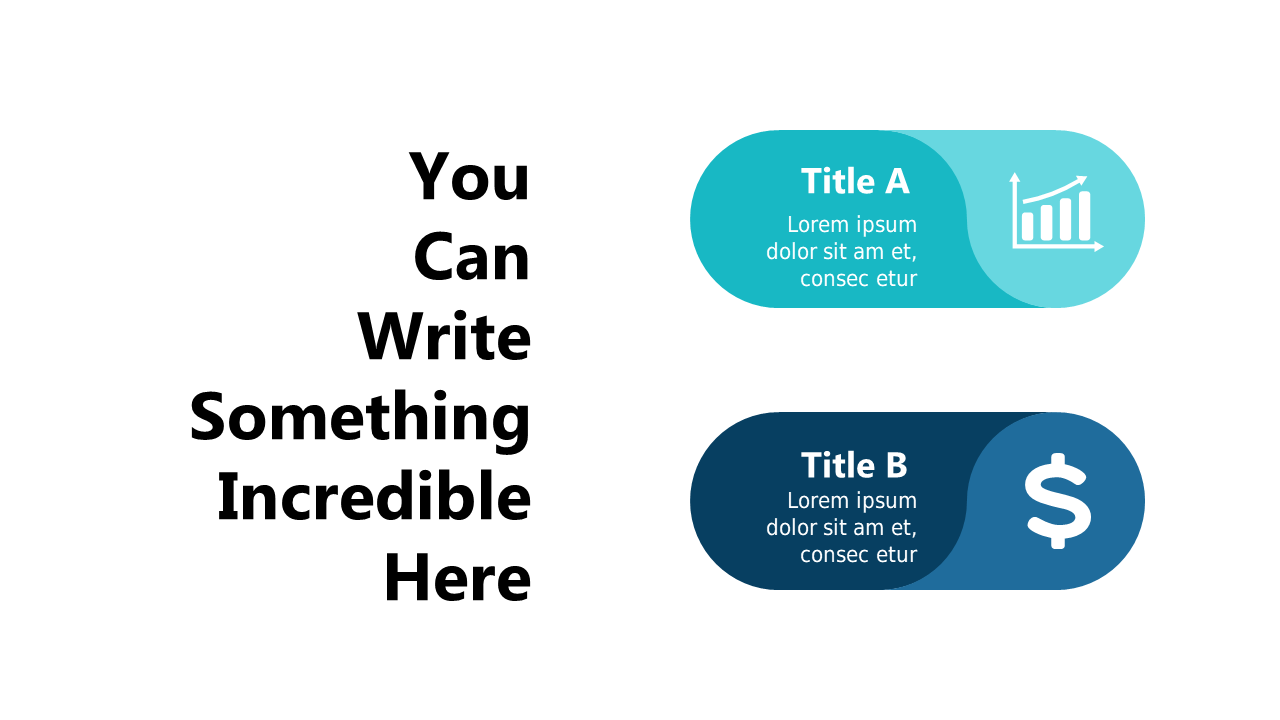
Product Description
When you’re facing the task of analyzing multiple options, presenting your findings clearly can often be a challenge. This dual comparison layout provides a straightforward way to lay out contrasting information side by side, making it easier for your audience to understand the distinctions.
The visual elements enhance comprehension and keep focus on your key points. Consultants dissecting alternatives, marketing teams evaluating different campaigns, or product designers comparing features will find this slide invaluable. It’s an excellent choice for any meeting where contrasting information can drive discussion, making complex data much more approachable.
At just $0.99, this slide is available for instant download and can be easily edited in PowerPoint and Google Slides. You can modify the icons and descriptions to fit your project, allowing you to prepare your presentation in just a few minutes.
$0.99 – Purchase Checkout
Added to cart