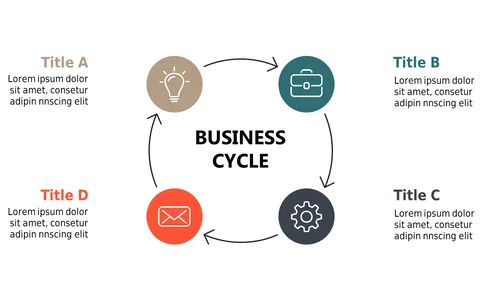
Circular Business Process Diagram with Icons
Product Description
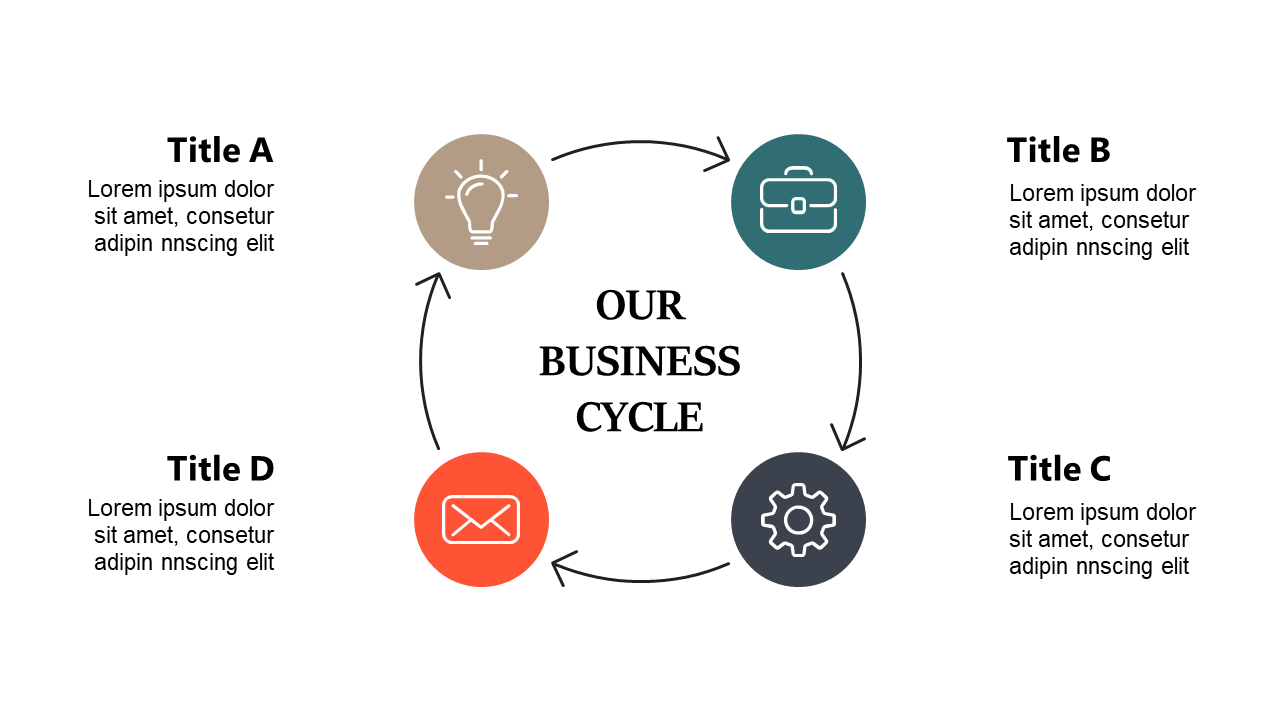
Explaining interconnected business processes can sometimes feel like trying to weave a complex story without a clear map. A lack of visual representation can leave your audience confused about how components fit together. This circular business process diagram offers a straightforward method to illustrate relationships among various elements, enhancing clarity in your presentation.
Consultants and strategists can use this diagram during client presentations or internal strategy meetings to explain operational workflows. It’s also beneficial for sales professionals outlining a sales process or marketing teams discussing customer journeys.
With clear icons and titles, your audience will grasp the connections in no time. For just $0.99, you can download this slide immediately, and it’s fully editable in both PowerPoint and Google Slides. Tailor the text and icons to fit your business needs quickly, ensuring your message is clear and effective.
$0.99 – Purchase Checkout
Added to cart