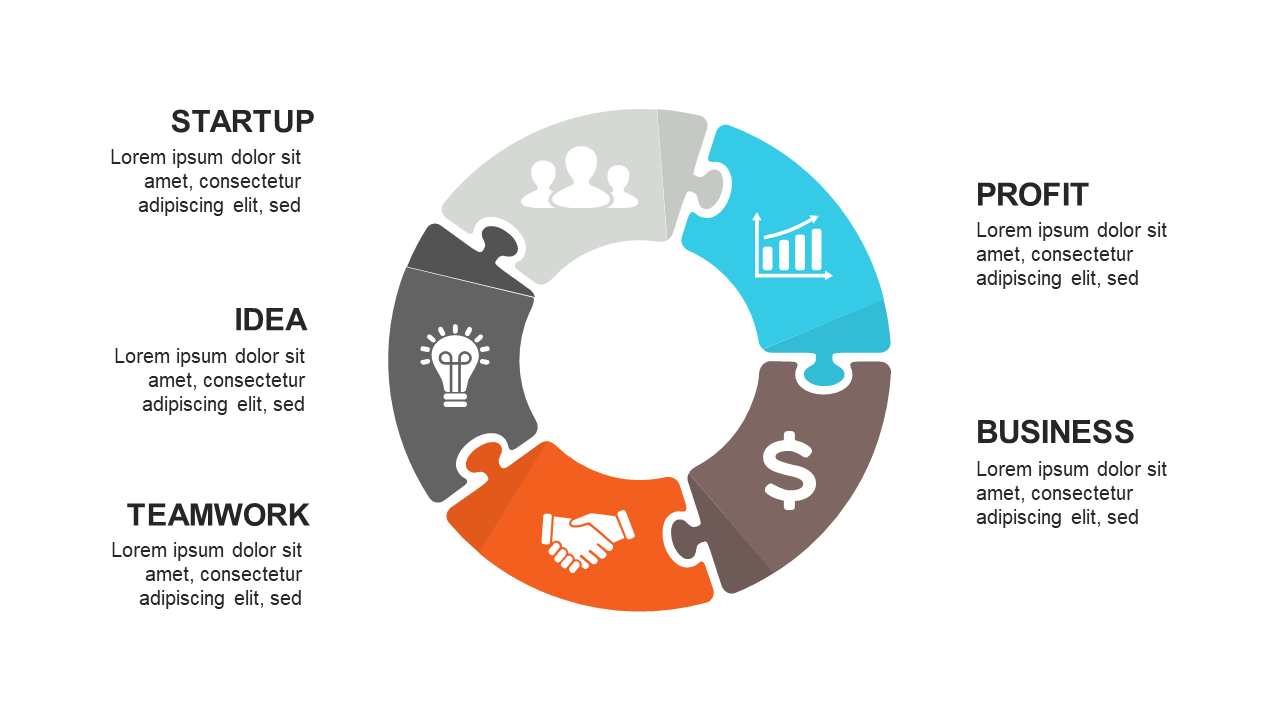
Customizable Circular Puzzle Diagram for Business Concepts
Product Description
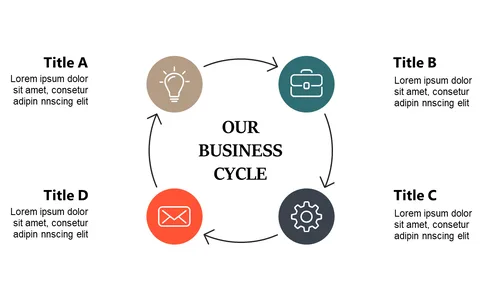
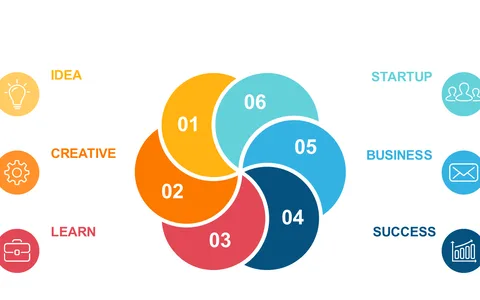
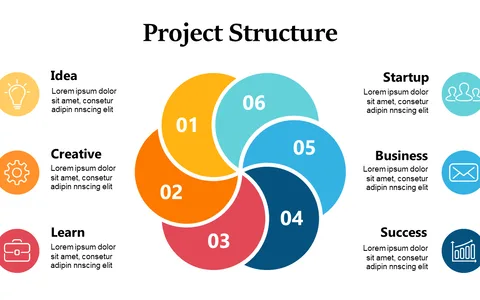
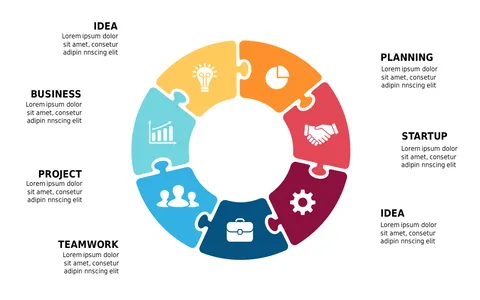
When you need to explain complex business relationships, finding a clear way to represent those connections can make a huge difference. This customizable circular puzzle diagram allows you to break down intricate concepts into digestible segments, ensuring your audience stays engaged and informed.
Whether you’re a project manager leading a cross-functional team, a business analyst presenting data insights, or a marketing director pitching a new strategy, this slide will enhance your storytelling. It’s perfect for board meetings where clarity is paramount, or team workshops focused on collaborative problem-solving.
For just $0.99, you can download this slide and edit it quickly in PowerPoint or Google Slides. Customize it to fit your needs and start making an impact in your presentations in minutes.
$0.99 – Purchase Checkout
Added to cart