Visualize Business Cycles with Circular Diagram
Product Description
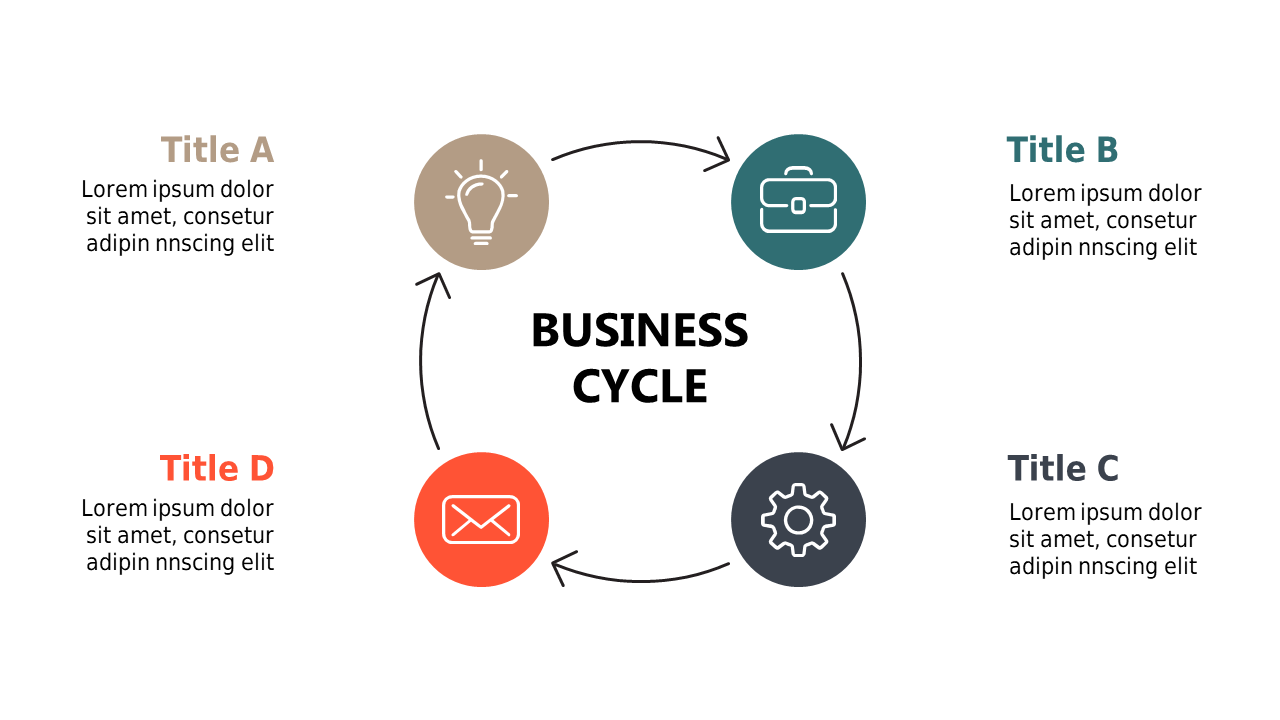
Business cycles can be hard to communicate, especially when you want to show how various stages interconnect. Without the right visuals, your audience might miss key points.
A circular diagram effectively highlights the cyclical nature of business processes, making it easier to explain complex relationships and stages. This slide is perfect for consultants presenting market trends, operations managers discussing production cycles, or finance professionals detailing economic cycles. Whether in a boardroom or a classroom, this diagram helps convey your message clearly and concisely, ensuring that every stage is understood.
Download this customizable slide for just $0.99, and you’ll have a ready-to-use tool in both PowerPoint and Google Slides. It’s easy to adapt the icons, labels, and colors to match your branding, allowing you to present information in a visually appealing format in minutes.
$0.99 – Purchase Checkout
Added to cart







