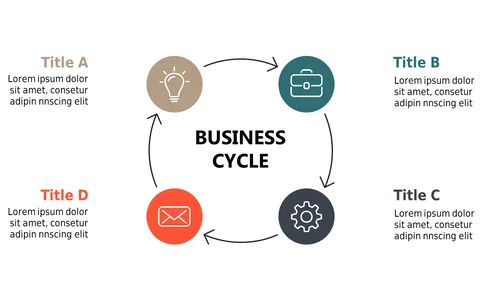
Circular Puzzle Diagram for Business Strategy

Product Description
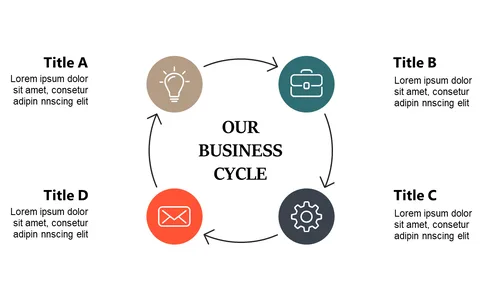
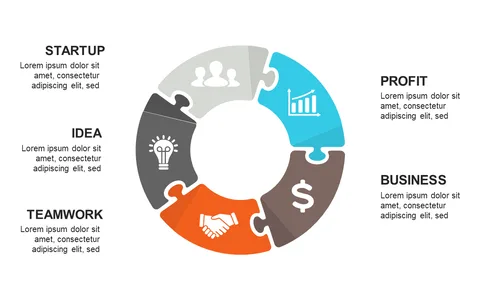
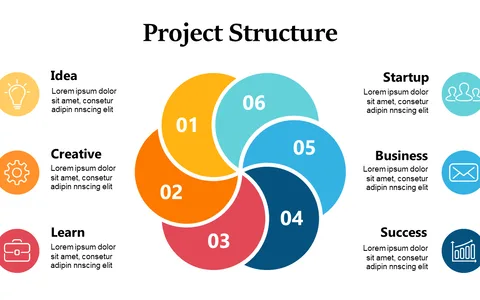
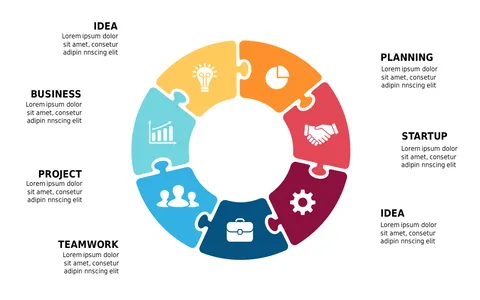
Illustrating interconnected business strategies can often be a challenge, especially when trying to convey complex ideas clearly. This circular puzzle diagram offers a unique approach to presenting these concepts, enabling you to visually segment important business elements.
It simplifies your message, enhancing understanding and engagement from your audience. This layout is ideal for strategy consultants, finance professionals, and project leads presenting in board meetings or team discussions. It’s particularly useful when discussing topics like growth initiatives, financial planning, or collaborative efforts, allowing you to depict how different aspects work together cohesively.
At just $0.99, this slide is ready for immediate download and can be customized in PowerPoint or Google Slides. You’ll find it easy to modify, helping you put together a comprehensive and polished presentation in minutes.
$0.99 – Purchase Checkout
Added to cart