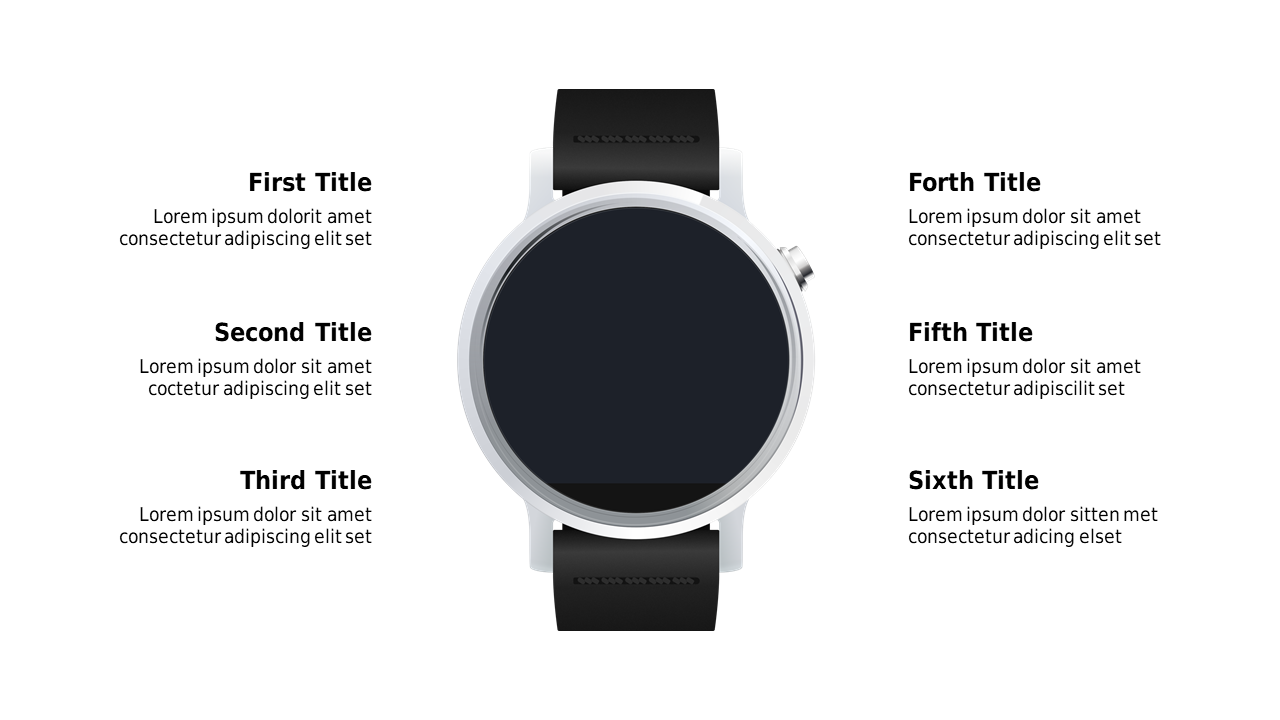
Highlight Key Features Around Watch Graphic
Product Description
Presenting intricate features can be a daunting task, especially when trying to keep your audience engaged. This slide helps you simplify complex information using a central watch graphic surrounded by key points, making it visually appealing and easy to understand at a glance.
Consultants in tech, health, or consumer goods can use this layout in client meetings or product demos to highlight essential features effectively. Whether you’re discussing software capabilities or new product developments, this slide sets the stage for clear communication.
For just $0.99, you can download this slide and start customizing it in minutes. It’s fully editable in PowerPoint and Google Slides, allowing you to tailor it to your specific needs without any hassle.
$0.99 – Purchase Checkout
Added to cart







