Present Key Events with Milestone Circles V2

Product Description
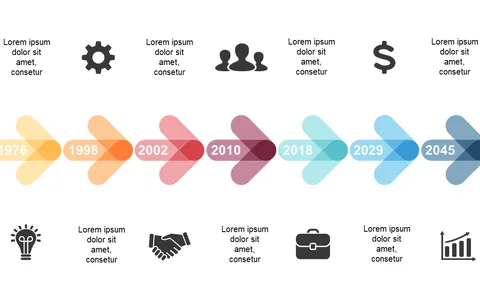
It’s challenging to keep your audience engaged while presenting a timeline, especially when you have multiple achievements to showcase. This slide offers a visually appealing way to highlight key events, connecting them with milestone circles that draw attention and make the information easier to digest.
Ideal for project managers working on annual reviews, educators laying out historical timelines, or marketers detailing product launches, this slide fits right into various industries. You can guide your stakeholders through your accomplishments and keep everyone on the same page without overwhelming them with data.
Available for just $0.99, this slide is easy to edit in PowerPoint and Google Slides. Download it now and customize it quickly to fit your presentation needs, so you can focus on delivering your message effectively.
$0.99 – Purchase Checkout
Added to cart