Visualize Cycles with Colorful Circular Diagrams
Product Description
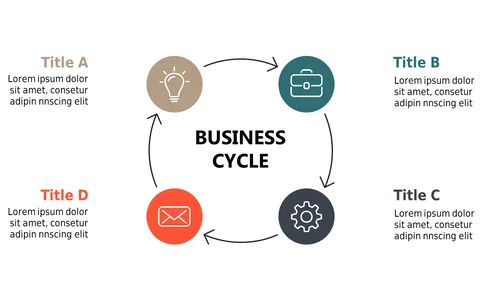
Engaging your audience while explaining cyclical processes can be quite challenging, especially when you’re trying to maintain their interest. A standard presentation can fail to convey the fluidity of these processes.
This dynamic circular diagram provides a clear outline of each step, allowing you to break down complex ideas into intuitive visuals that resonate with your audience. This slide is suited for project managers discussing iterative workflows, educators teaching concepts in a circular manner, or operations teams reviewing continuous processes. You can incorporate this eye-catching design into your presentations and help your audience grasp the essential information without getting lost in details.
For just $0.99, you can quickly download this slide and make it your own. It’s easily editable in PowerPoint and Google Slides, so you can have it polished and ready for your next event in just minutes.
$0.99 – Purchase Checkout
Added to cart