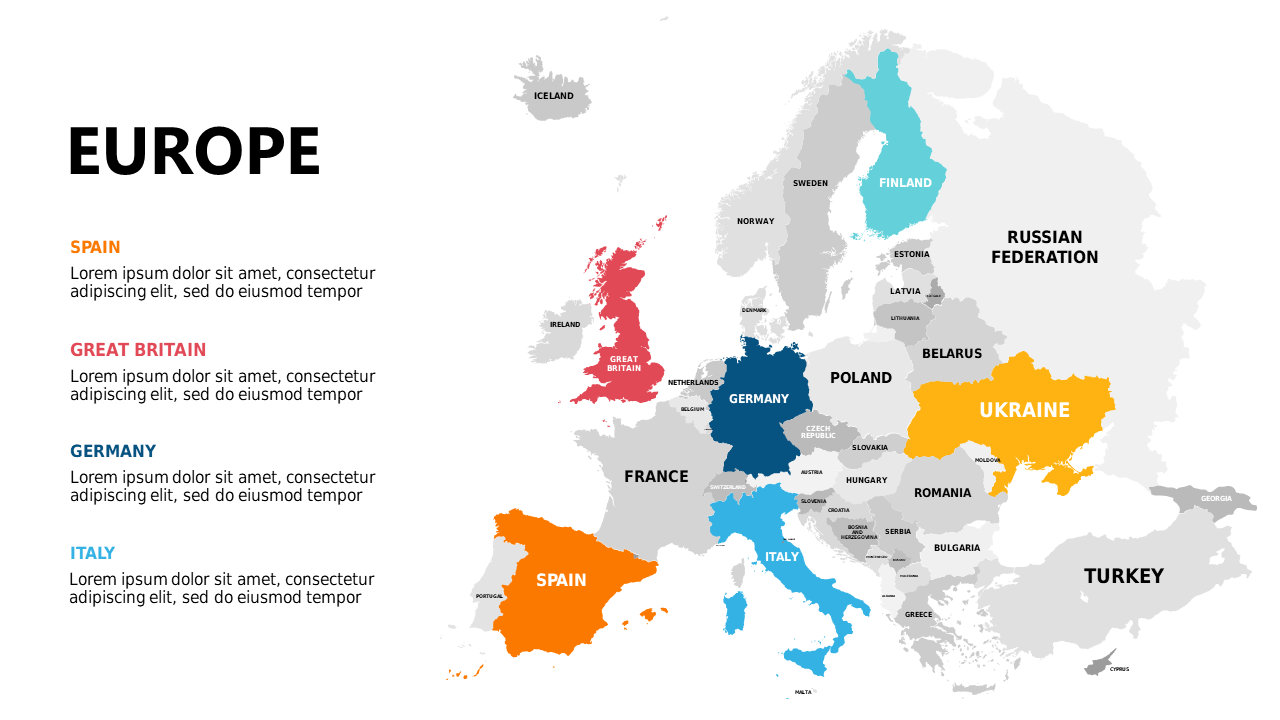
Present Geographic Data with Color-Coded Europe Map
Product Description
Struggling to convey complex geographic data in a way that resonates with your audience? This color-coded map of Europe helps you to visually represent market analysis and regional demographics, making it easier to highlight trends and insights that matter. You can show differences in economic zones or highlight areas of opportunity without losing clarity.
This slide is perfect for data analysts working in international markets, marketing professionals preparing for regional sales meetings, or project managers collaborating on cross-border ventures. Whether you’re presenting to your team or pitching to clients, this map serves as an engaging visual aid that captures attention and enhances understanding.
For just $0.99, you get instant access to a fully editable slide that works effortlessly in both PowerPoint and Google Slides. Spend less time formatting and more time polishing your message, as
you can customize the map to fit your needs in minutes.
$0.99 – Purchase Checkout
Added to cart