Engaging Laptop Comparison with Usability V5
Product Description
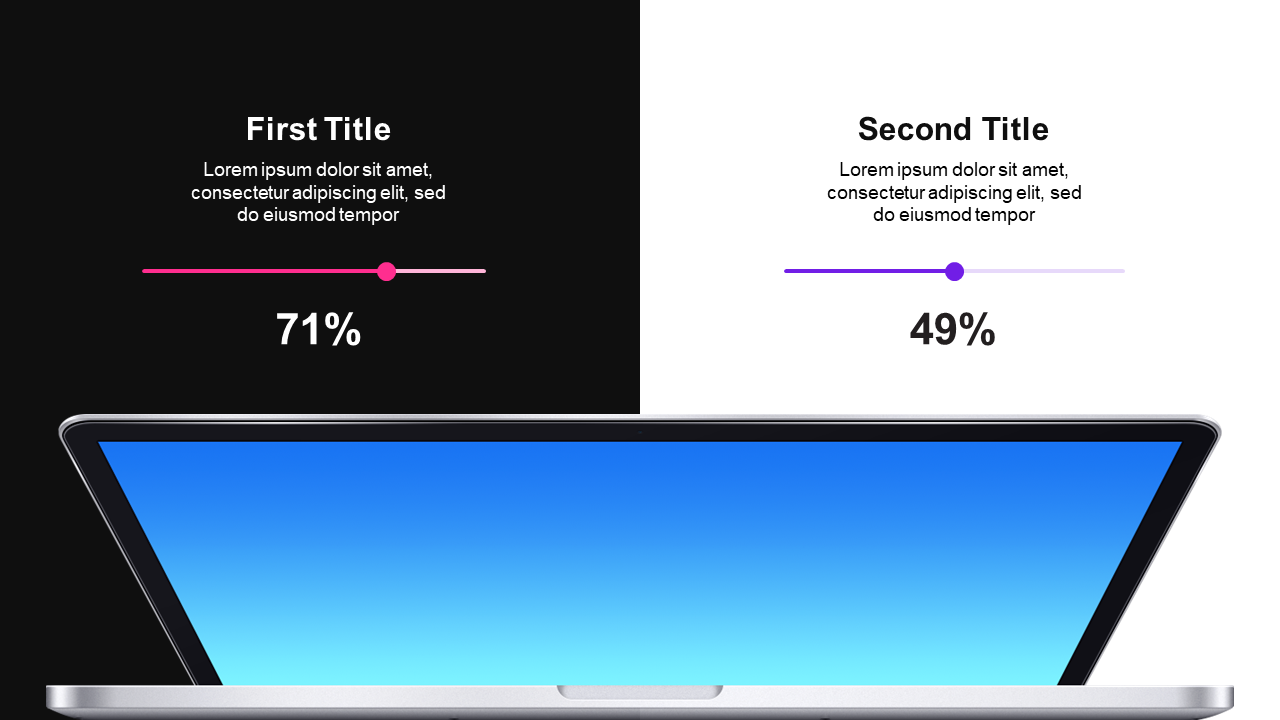
Wondering how to visually compare two laptop metrics without overwhelming your audience? It’s crucial to present data clearly so that your audience can absorb it effectively. This engaging slide format provides a side-by-side comparison that makes distinctions easy to see.
IT professionals and business analysts can use this slide during performance reviews or product assessments. The interactive slider elements are excellent for demonstrating percentage changes or feature comparisons, adding a dynamic touch to your presentations while keeping them straightforward.
At just $0.99, this slide is ready for instant download and quick edits.
You can customize it in PowerPoint or Google Slides, ensuring that your presentation is organized and impactful in minutes.
$0.99 – Purchase Checkout
Added to cart







