Compare Laptop Features Across Usability and Design
Product Description
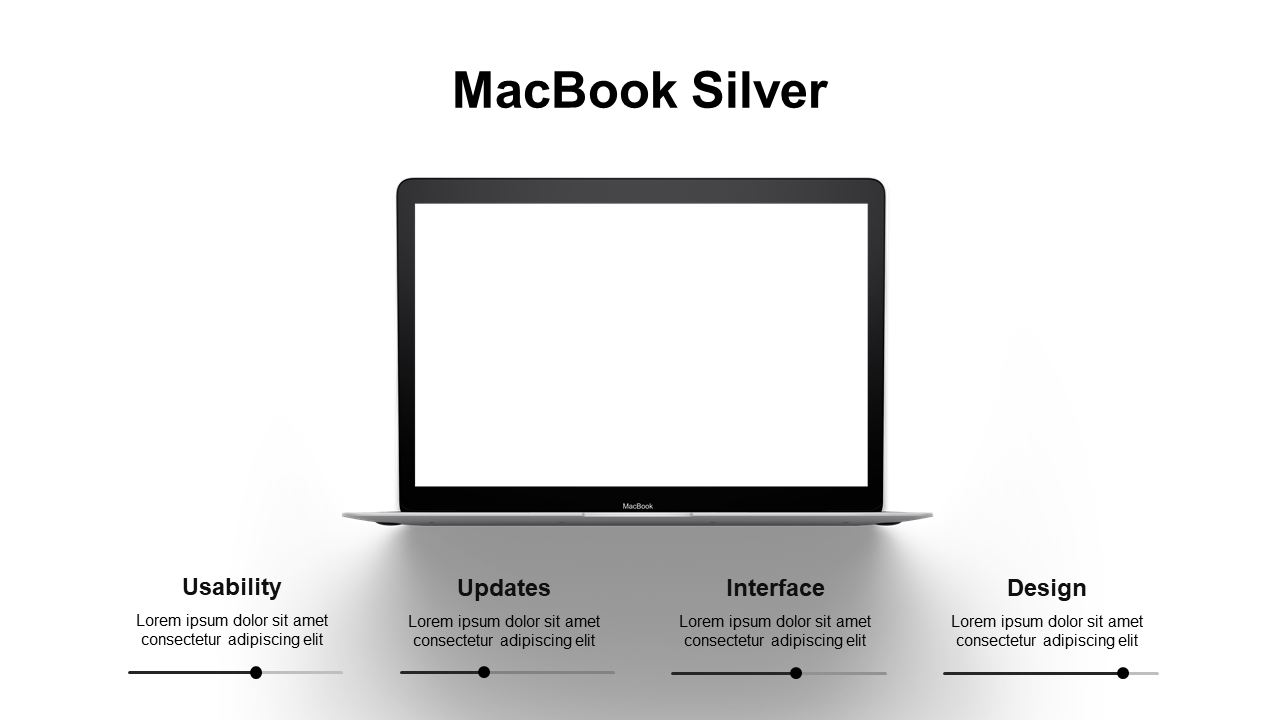
Comparing product features can often lead to confusion if not presented clearly. This layout helps you neatly organize comparisons across Usability, Updates, Interface, and Design, making it easier for your audience to grasp the differences.
It’s designed to clarify and enhance your message, turning complex information into clear insights. Perfect for product managers, marketers, and tech professionals, this slide is ideal for presentations where you need to compare various products or features. Use it during strategy meetings or product launch events to ensure your audience understands the key differentiators.
For just $0.99, you can download this slide immediately and start customizing it to meet your presentation needs. It’s easy to edit in both PowerPoint and Google Slides, making preparation quick and efficient.
$0.99 – Purchase Checkout
Added to cart







