Present Distinct Categories with Triangular Icons
Product Description
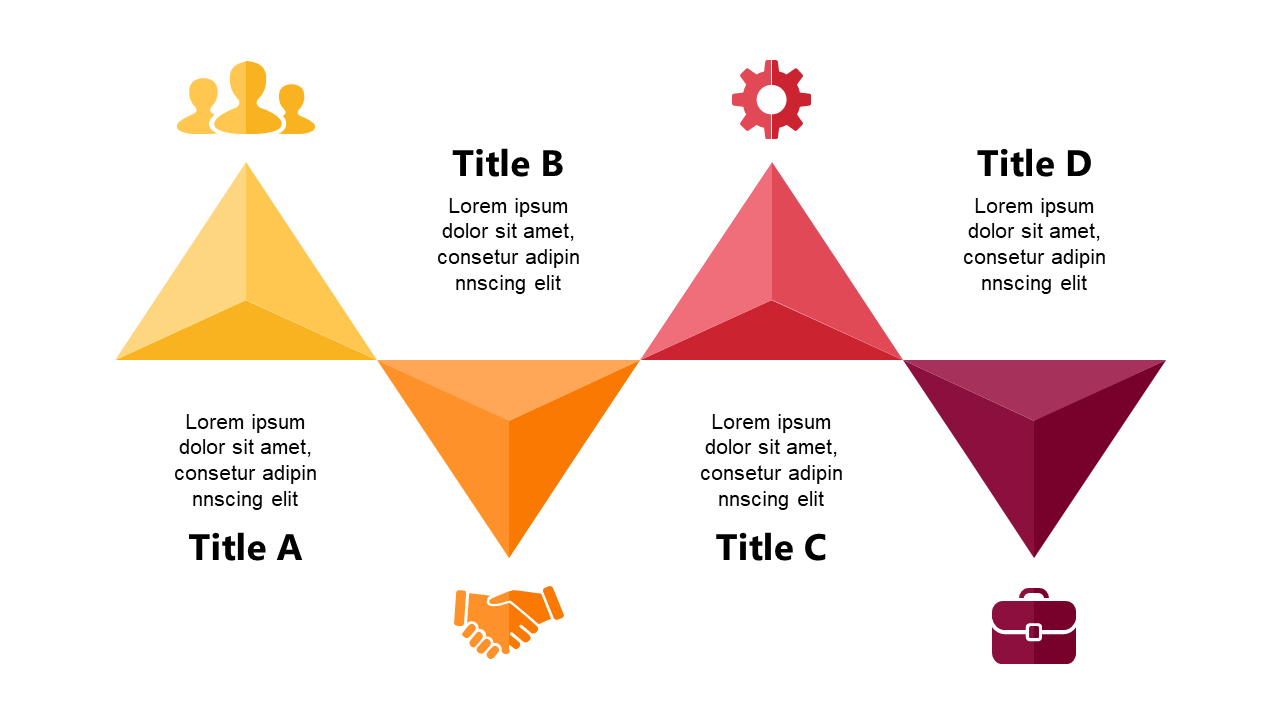
When you need to communicate complex information clearly, visuals can make a huge difference. This triangular comparison slide is designed to showcase distinct categories with corresponding icons, making it easy for your audience to follow along and grasp essential points without confusion.
Consultants working on client presentations, educators explaining critical concepts, or product managers evaluating design options will find this slide invaluable. It’s an effective tool for workshops, client meetings, or educational settings, where clarity is key to comprehension.
For only $0.99, you can instantly download this slide. It’s simple to edit in PowerPoint and Google Slides, allowing you to make it your own in just a few minutes.
$0.99 – Purchase Checkout
Added to cart







