Visualize Comparisons with a Triangular Layout
Product Description
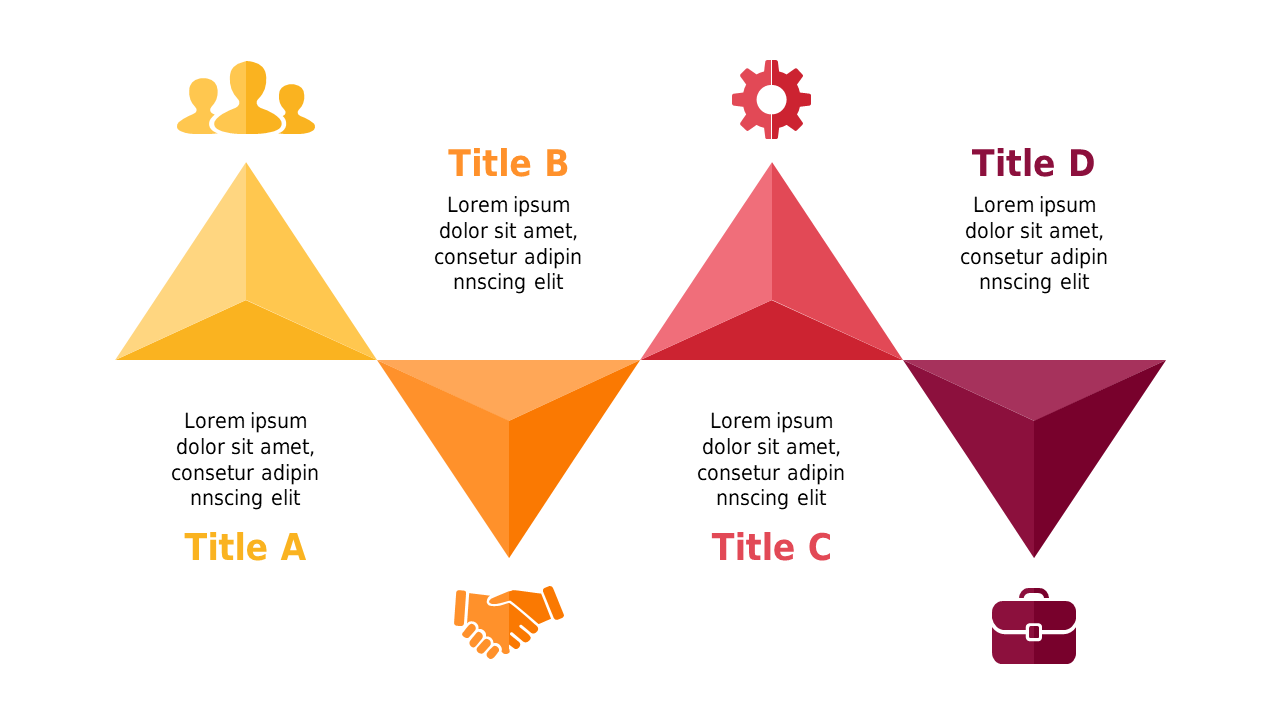
In a fast-paced work environment, conveying key comparisons clearly is vital for effective decision-making. The triangular layout of this comparison slide presents information in an engaging way, ensuring your audience grasps the nuances between various options without getting lost in the details.
This slide is perfect for business analysts dissecting product advantages, HR professionals comparing employee benefits, or finance teams evaluating budgetary options. Incorporate it into your reports, presentations, or training sessions to drive home important points with visual clarity.
Download this slide today for only $0.99. It’s ready to go in PowerPoint and Google Slides, and
you can easily customize it to fit your specific requirements within minutes.
$0.99 – Purchase Checkout
Added to cart







