Compare Key Points with Three-Column Icon Layout
Product Description
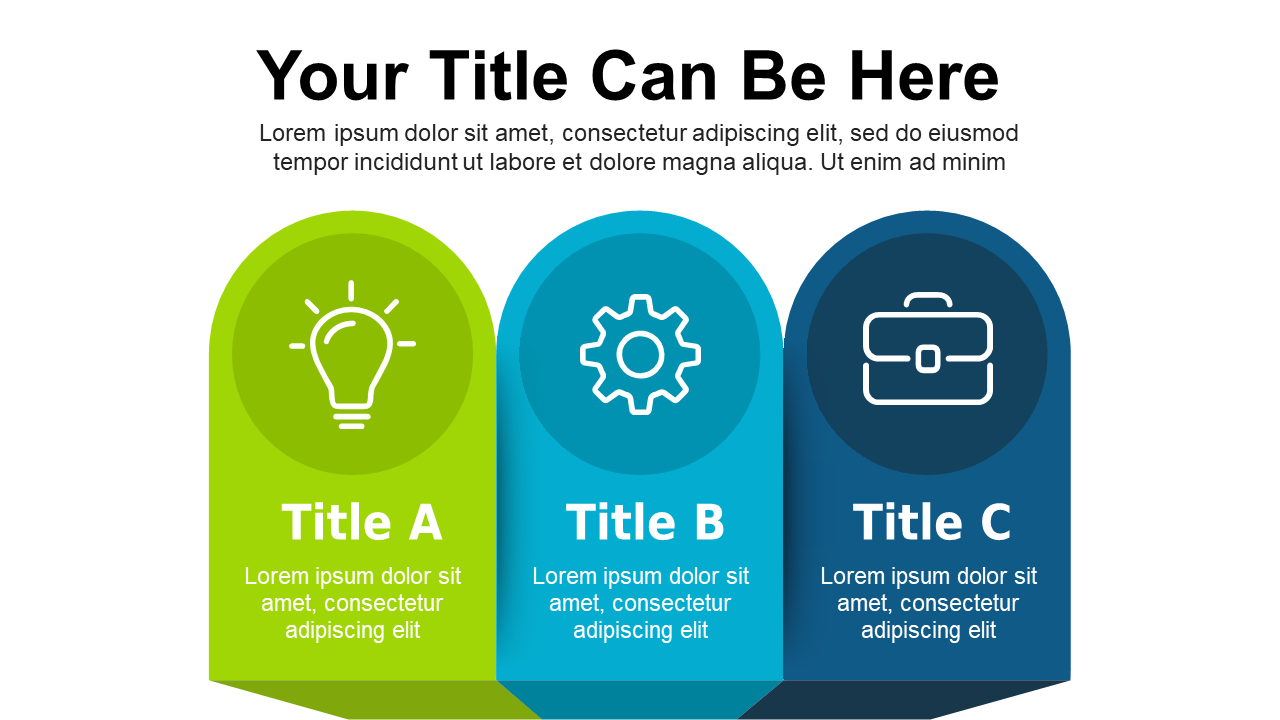
When you’re tasked with delivering clear information under tight deadlines, finding the right way to present data is crucial. This slide offers a three-column layout that allows you to compare key points side by side, making your message straightforward and engaging.
Great for analysts preparing reports, sales teams showcasing product comparisons, or educators organizing content for lectures, this slide simplifies complex ideas. It’s designed to help you communicate efficiently, making it a valuable tool for anyone who needs to present information clearly.
At a price of $0.99, you can download this slide immediately and modify it in minutes. It’s compatible with both PowerPoint and Google Slides, making it a quick and easy addition to your presentation arsenal.
$0.99 – Purchase Checkout
Added to cart







