Present Key Points with Three-Point Comparison
Product Description
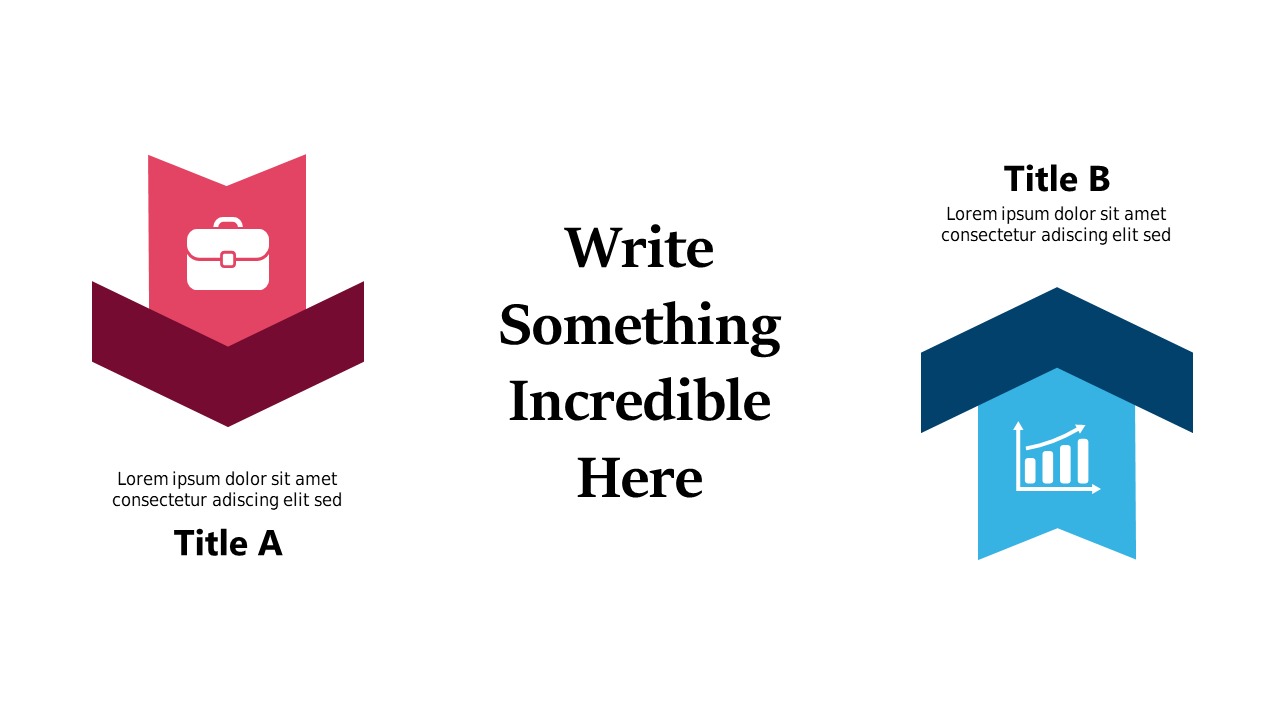
When you need to present complex information quickly, clarity is key to avoiding confusion. This three-point comparison slide allows you to showcase critical points side-by-side, making understanding easier for your audience. With dedicated spaces for icons and text, you can highlight similarities and differences in a visually appealing way.
This template works brilliantly for presenters in roles like business development, marketing, or project management, especially during decision-making meetings or presentations. For example, you can use it to compare service offerings, product specs, or sales strategies, helping different teams stay aligned.
It’s designed to make your comparisons straightforward across any sector. For only $0.99, you can download this slide and start editing immediately. It’s compatible with PowerPoint and Google Slides, ensuring you can tailor it effortlessly for your next presentation.
$0.99 – Purchase Checkout
Added to cart







