Compare Concepts Visually with Triangular Layout
Product Description
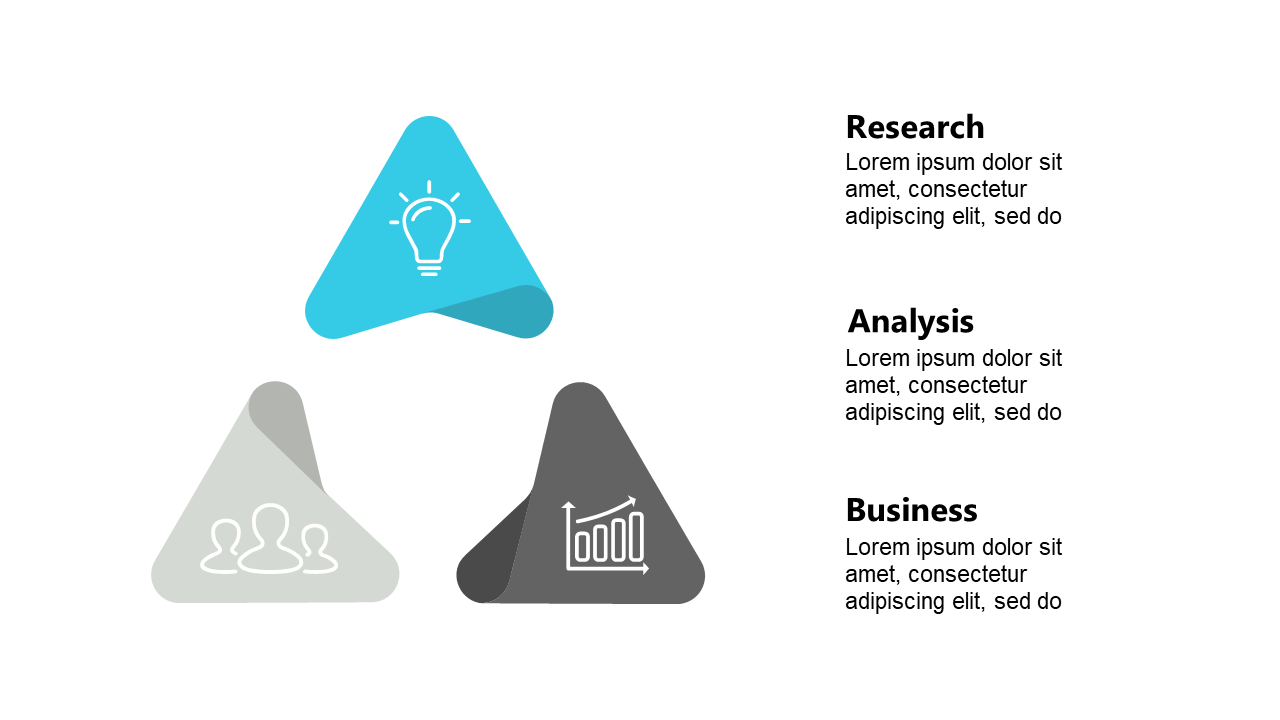
When tasked with presenting multiple concepts, it’s easy for your audience to get lost in the details. This slide’s triangular layout makes it clear and straightforward to compare three distinct ideas side by side, ensuring your audience stays engaged and understands the nuances of each concept. The use of icons adds visual interest, making your presentation more appealing.
Marketing professionals or product developers often need to present different ideas in strategic meetings or brainstorming sessions. This slide is ideal for those moments when clarity is key, allowing you to highlight key differences and advantages of various concepts to your team or leadership.
It’s a practical visual aid that can elevate your presentations. At just $0.99, you can download this slide right away and customize it to meet your specific requirements. It’s fully editable in PowerPoint and Google Slides, allowing you to integrate it into your presentations with ease.
$0.99 – Purchase Checkout
Added to cart







