Visualize Innovative Ideas Against Growth Metrics V3

Product Description
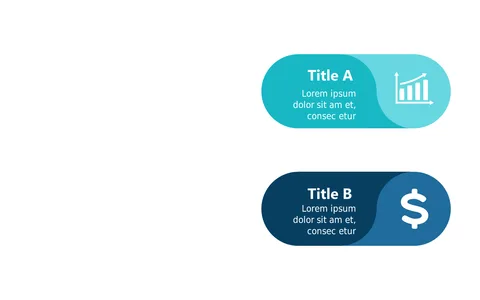
The challenge of clarifying how innovative ideas measure up against growth metrics can leave you feeling frustrated, particularly when your audience is eager for insights. This slide adeptly bridges that gap with a compelling side-by-side comparison that enhances understanding and engagement. It ensures your audience can quickly grasp the significance of both aspects in your presentation.
This slide is particularly useful for product managers as they present new feature ideas alongside user growth statistics in product review meetings. Marketing teams can leverage it to compare innovative campaign strategies against past performance during team brainstorm sessions.
Its clear layout fosters effective communication and drives home your message. Available for only $0.99, this slide is ready for immediate download and can be easily edited in PowerPoint and Google Slides. You’ll have it customized in no time, making your presentation impactful and visually striking.
$0.99 – Purchase Checkout
Added to cart