Key Shaped Template for Multi-Category Comparison
Product Description
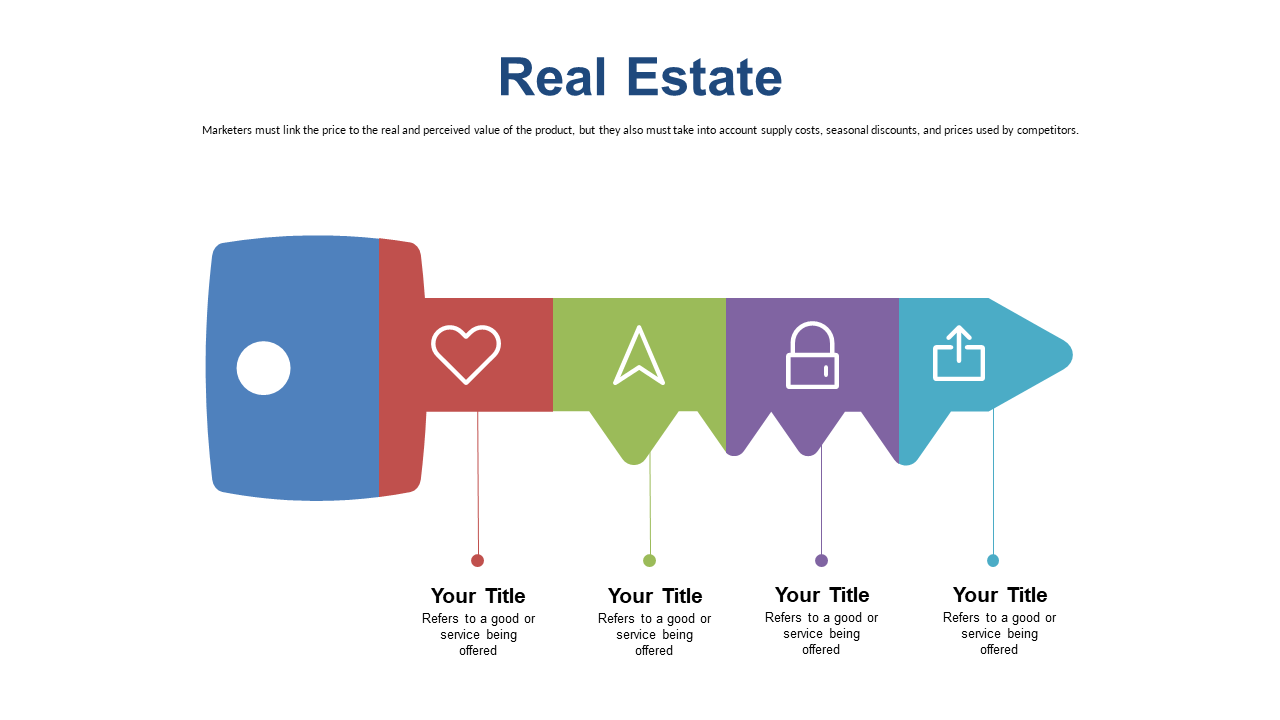
When trying to compare multiple categories in your presentation, you don’t want your audience drowning in details or struggling to grasp the differences. This key-shaped template simplifies comparisons, allowing your listeners to see key distinctions at a glance. The colorful segments make it easy to differentiate between categories without any confusion.
This slide is perfect for product managers presenting multiple features of a new software application or marketing teams discussing different campaign strategies. You might also find it useful in educational settings where educators compare various teaching methodologies or research findings. No matter the industry, this slide will make your analysis straightforward and visually appealing.
For just $0.99, you can download this slide instantly and get started right away. It’s fully editable in PowerPoint and Google Slides, so
you can customize it to fit your needs in minutes.
$0.99 – Purchase Checkout
Added to cart







