Engaging Comparison of Services with House Icons
Product Description
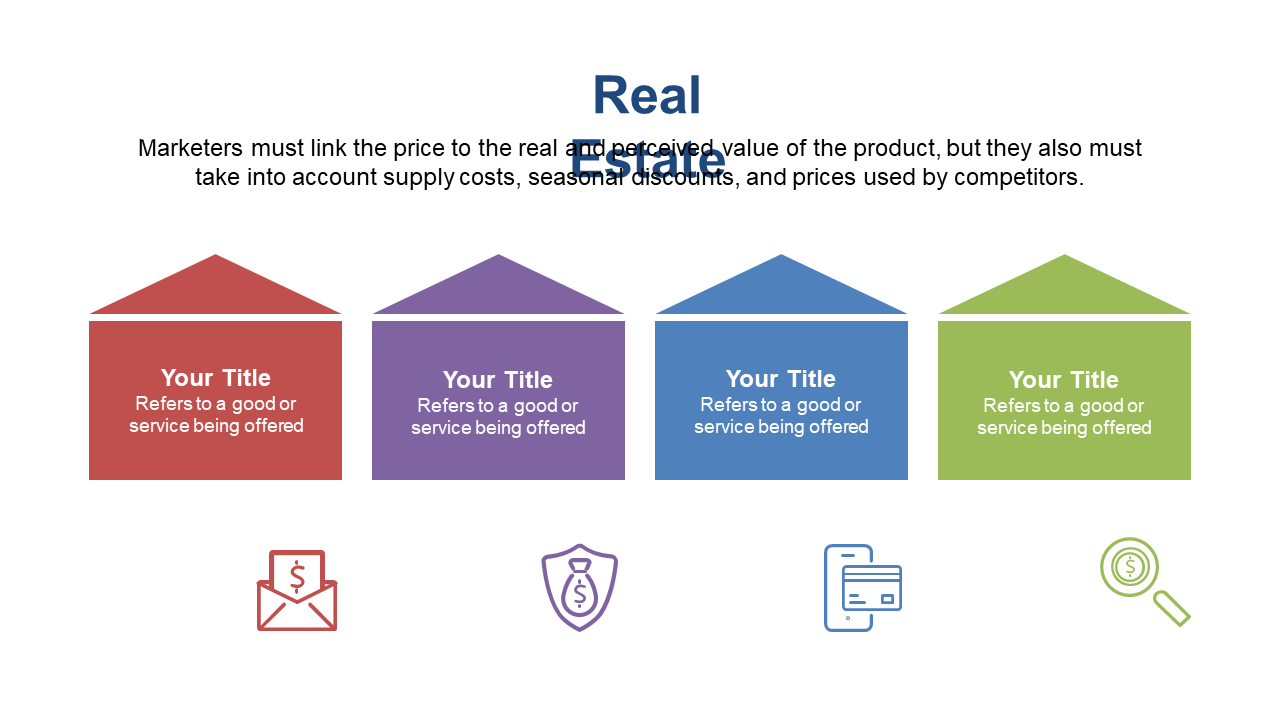
In a competitive sales environment, the ability to compare services quickly and clearly is essential for closing deals. This engaging slide simplifies that process with visually distinct house icons, each representing different services or products.
It makes it easier for your audience to grasp the differences at a glance. Ideal for real estate agents, sales teams, and service marketers, this slide fits perfectly into presentations where options need to be compared side-by-side. Use it in sales pitches, team briefings, or even webinars to ensure everyone understands your offerings without confusion.
For just $0.99, you can download this slide today and start editing it to suit your presentation needs. It’s ready to go in PowerPoint and Google Slides, making it a quick addition to your toolkit.
$0.99 – Purchase Checkout
Added to cart







