Analyze Products with Venn Diagram for Comparison
Product Description
In the fast-paced sales environment, making informed decisions quickly is essential. Relying solely on text-based lists can leave your audience confused and disconnected.
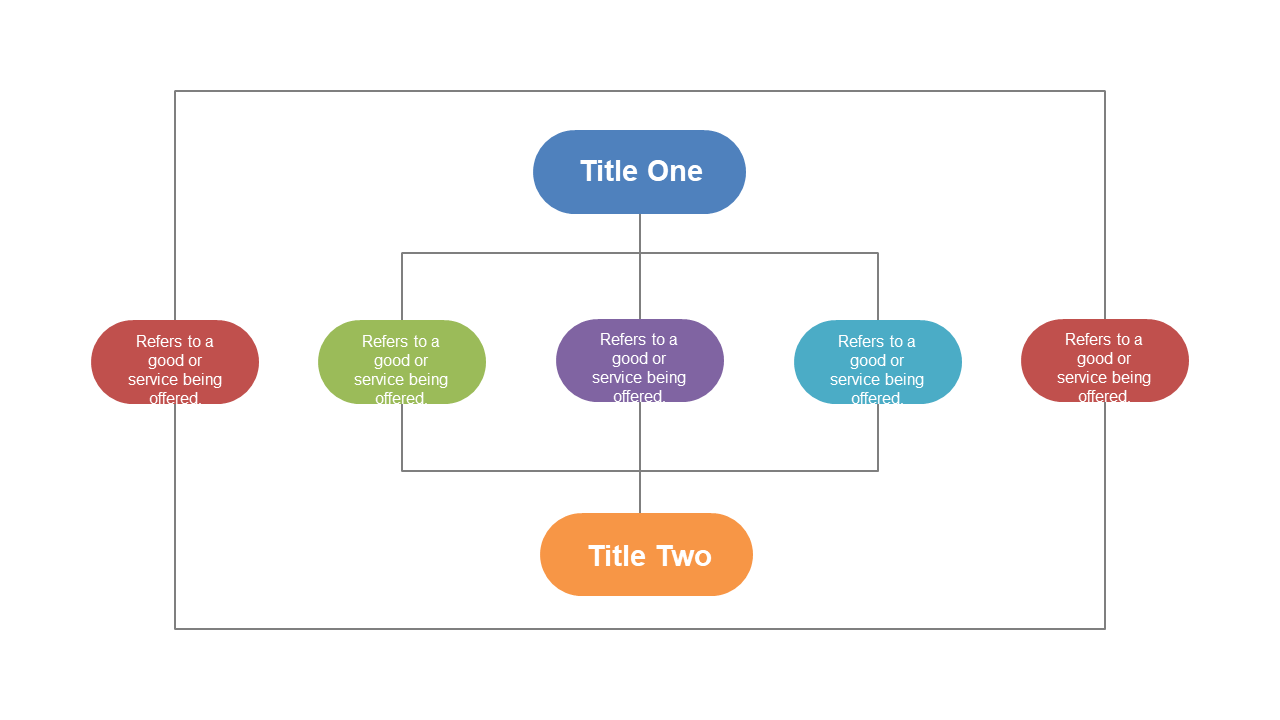
This Venn Diagram slide offers a visual approach to comparing products, clearly illustrating unique features and benefits side by side. Sales executives, product analysts, and marketing teams will find this slide particularly useful when they need to compare multiple offerings during strategy sessions or client consultations. By presenting information visually, you help your audience grasp complex relationships without getting bogged down in details.
For just $0.99, you can quickly download this slide and customize it to fit your needs. It’s easy to edit in both PowerPoint and Google Slides, ensuring you can make adjustments and have it ready in just a few minutes.
$0.99 – Purchase Checkout
Added to cart







