SlideSwift
By Category
💼Business 📊Infographics □Minimal 🕐Timelines ✨Neumorphic 🗑Diagrams 🔄Flow Charts ✨Glassmorphism 🎨Creative 🌍Abstract 🔄Cycle Diagrams 💎Isometric 🖼Illustrations 📱Social Media 🗺MapsBy Slide Type
🚀Pitch Deck 📌Roadmap 🔍SWOT Analysis 📅Timeline 📈Gantt Chart 🏢Org Chart 📋Funnel ⚖Comparison 📄Case Study 📋Agenda ⭐Icons & Lists 👏Thank You
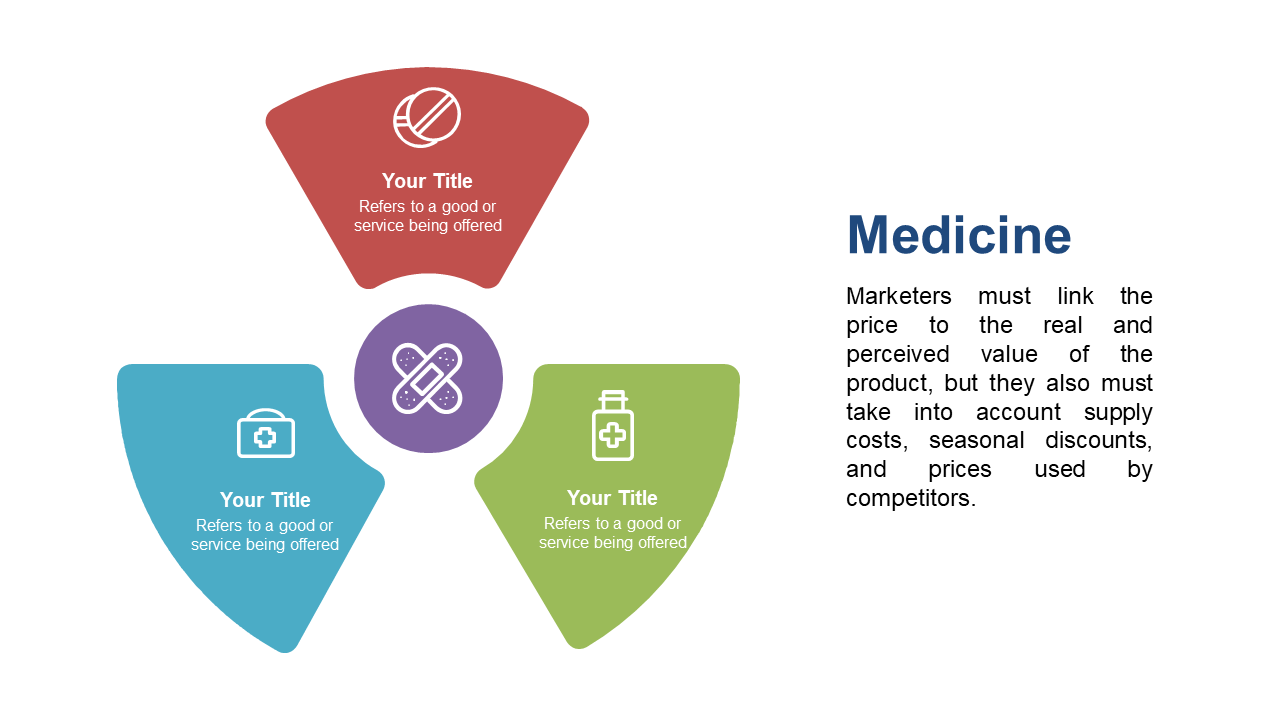
Making comparisons in your presentations can be tough, especially when clarity is crucial. This slide offers a visually appealing triple circle diagram, allowing you to showcase three related elements in a clear and engaging way. Each curved section is uniquely colored, making it easy to differentiate between the concepts you want to highlight. As a strategy manager, you can use this slide to outline competitive advantages, compare strategic options, or present project timelines. Analysts will appreciate how this slide helps in breaking down market trends by comparing different data sets, facilitating better decision-making. For consultants, this diagram is valuable when presenting various solutions to clients, ensuring they can easily grasp the distinctions between options. You can customize the colors and text to align with your brand or presentation style. $0.99 — add this single slide to any deck from the SlideSwift Slide Library. No subscription needed. Mix slides from any category to build your perfect deck.
Add more from this category to your custom deck