Compare Products with Hexagonal Comparison Matrix
Product Description
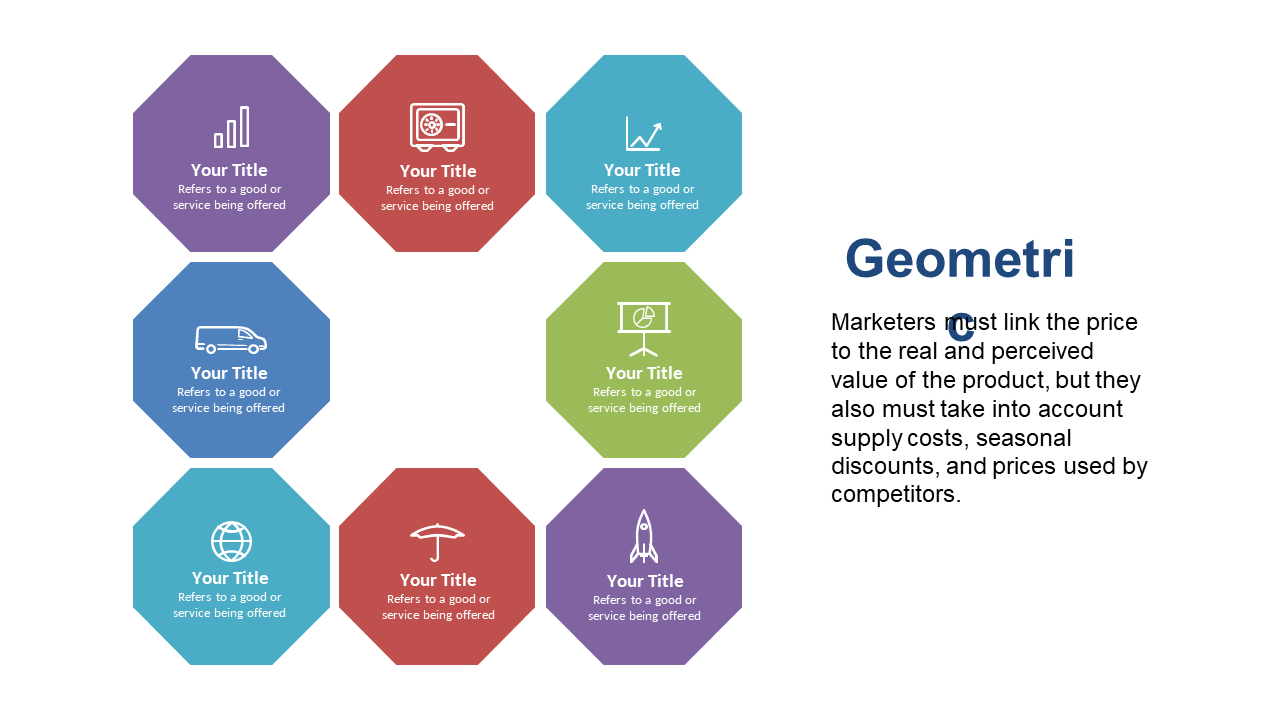
Comparing products can feel like piecing together a puzzle with missing pieces, especially when you’re pulling information from various sources. The hexagonal comparison matrix provides a straightforward and visually appealing way to highlight the key features and differences, letting your audience grasp important information right away.
Sales managers and product marketing teams can use this slide during client pitches or product demonstrations where clarity is crucial. It’s perfect for showcasing competitor offerings during quarterly reviews or for a product manager evaluating options in team meetings.
For just $0.99, you can download this slide instantly and edit it easily in PowerPoint or Google Slides. Make your product comparisons seamless and effective in just minutes.
$0.99 – Purchase Checkout
Added to cart







