Showcase Value Propositions Using Venn Diagram
Product Description
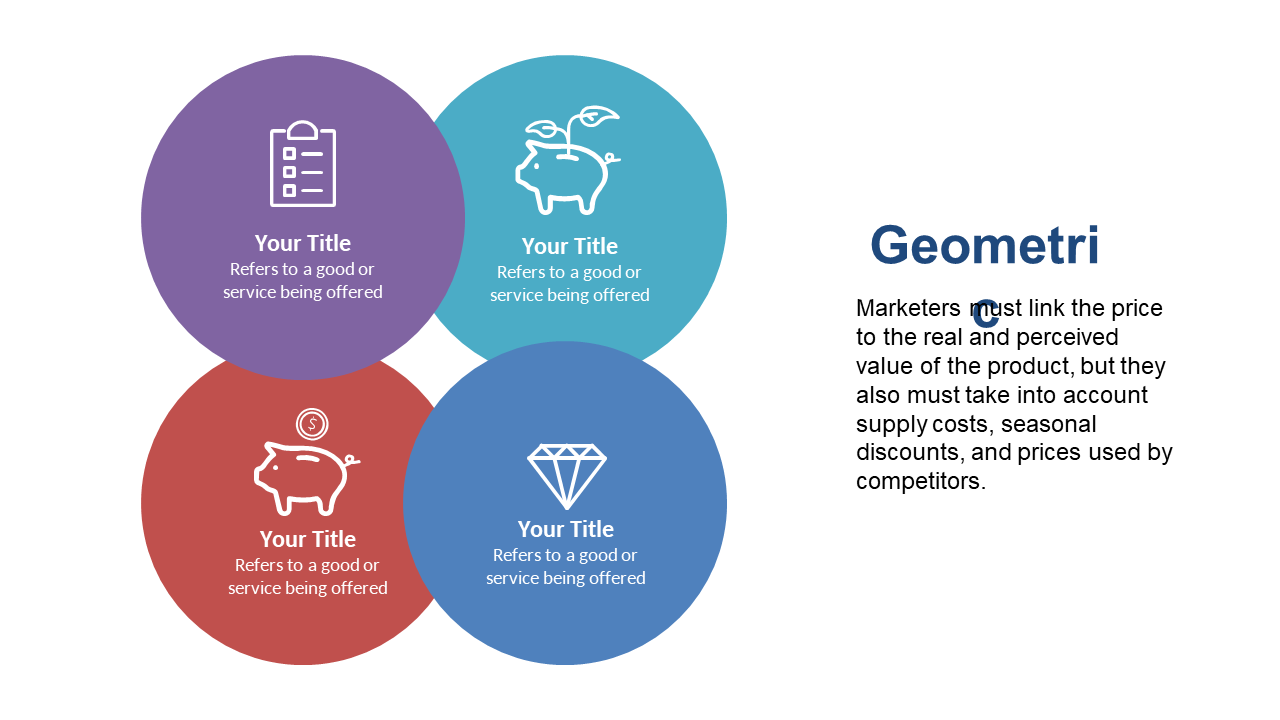
In a market filled with competition, showcasing your unique value proposition can often feel overwhelming. This Venn Diagram slide is designed to help you illustrate the complex relationships between different offerings clearly, making your presentation more impactful and relatable.
Business development managers, marketing strategists, and sales professionals will benefit from using this slide during pitch meetings or collaborative sessions. Whether you’re presenting a new product line to a sales team or discussing service offerings with clients, this diagram clarifies how your propositions stand out in the marketplace.
Available for just $0.99, this slide can be instantly downloaded and easily modified in PowerPoint and Google Slides. Make your next presentation shine in mere minutes with this valuable tool.
$0.99 – Purchase Checkout
Added to cart







