Evaluate Services with a Colorful Horizontal Comparison Chart
Product Description
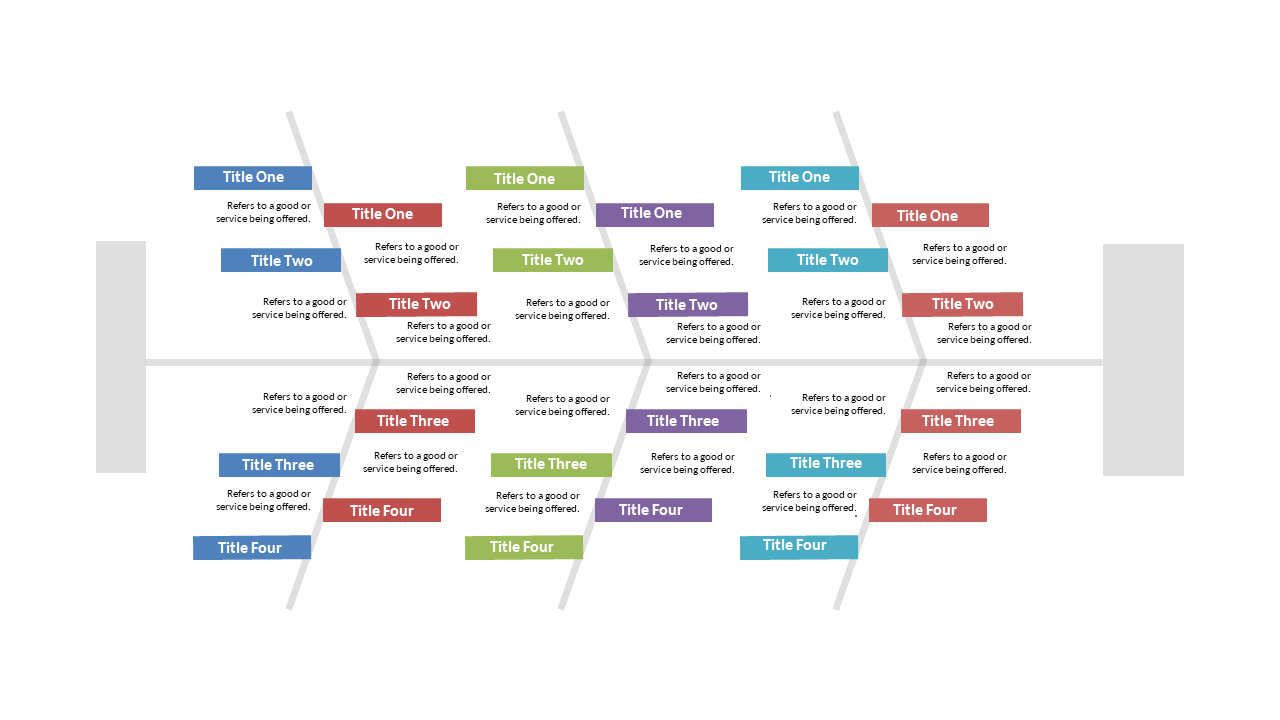
Evaluating multiple service options can lead to information overload, making it tough to compare effectively. This colorful horizontal comparison chart simplifies that process, providing a clear view of multiple services side by side.
Your audience will appreciate the straightforward layout, enabling them to make informed decisions. This slide is ideal for service managers comparing different offerings, HR professionals evaluating vendor options, or consultants laying out service packages for clients. By using this effective visual, you can ensure that key differences shine through and facilitate better discussions.
At just $0.99, this slide is quick to download and easy to edit in PowerPoint or Google Slides. In no time, you’ll have a polished comparison chart to enhance your next presentation.
$0.99 – Purchase Checkout
Added to cart







