Contrast Products Using Dual Circle Layout
Product Description
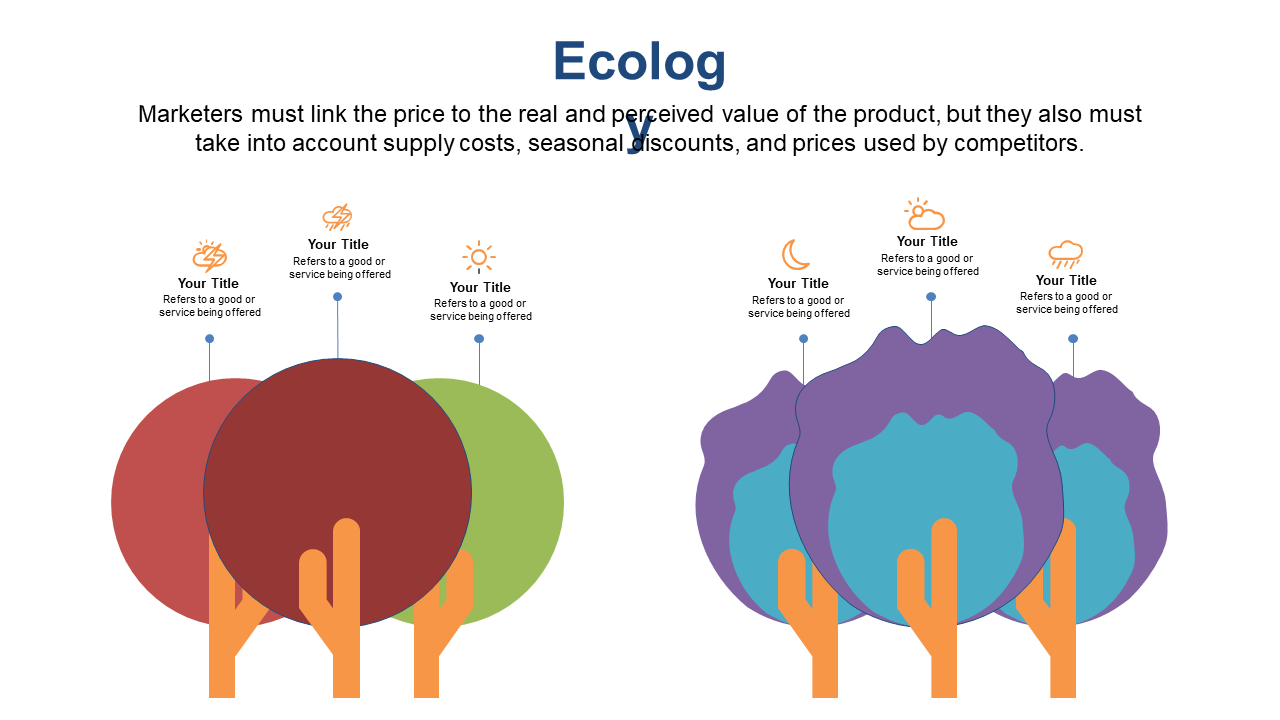
Highlighting the unique features of different products can often lead to confusion for your audience. With a clear dual circle layout, you can effectively showcase contrasts and similarities, making it easier for your viewers to grasp the distinctions at a glance. This slide is designed to engage and inform, turning complexity into clarity.
Whether you’re a product manager preparing for a comparison presentation or a marketing director pitching new product features to potential clients, this slide is your go-to tool. It’s perfect for tech firms unveiling multiple software applications or retail companies comparing various product lines. By visually demonstrating the differences with overlapping circles, you can create a memorable experience for your audience.
Download this slide for just $0.99 and gain instant access to a ready-to-use layout that’s fully editable in PowerPoint or Google Slides.
You can customize the content easily to fit your needs, allowing you to focus on delivering your message effectively.
$0.99 – Purchase Checkout
Added to cart







