Hexagonal Customer Journey Infographic
Product Description
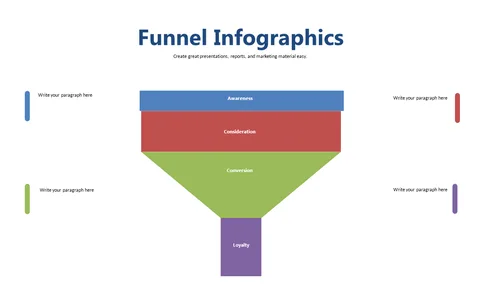
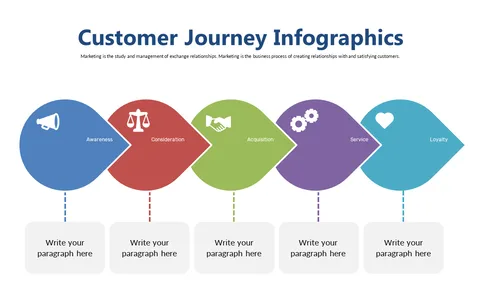
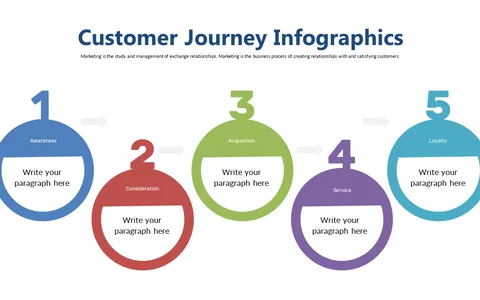
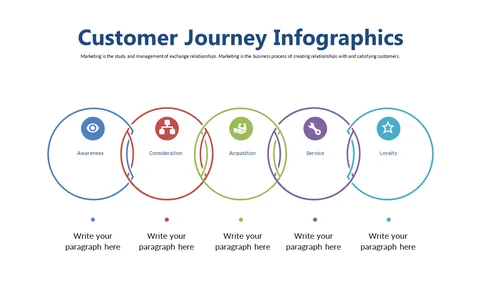
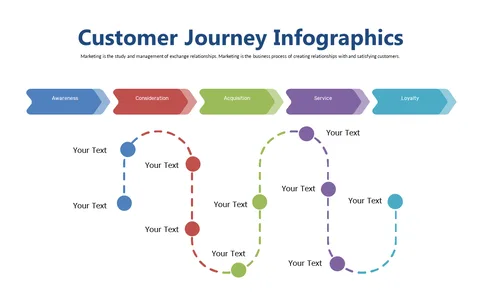
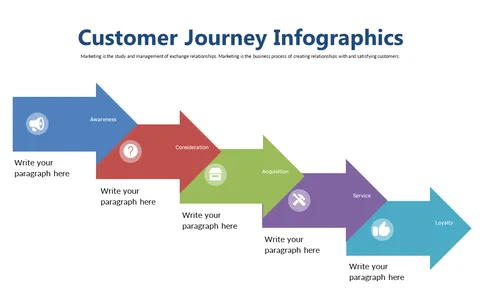
Translating the complexities of the customer journey into a clear visual format can often feel overwhelming, especially during critical meetings. You want everyone in the room to easily comprehend each distinct stage of the customer experience.
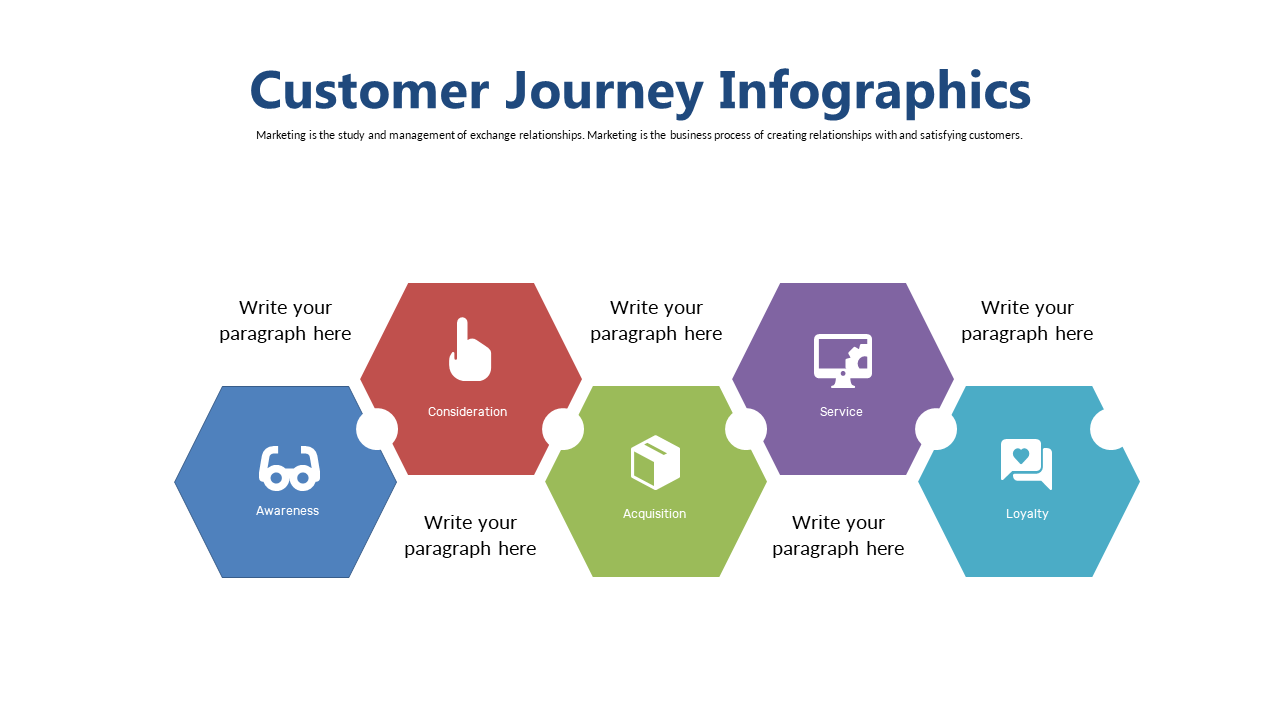
This hexagonal customer journey infographic makes it simple to showcase that process effectively. You’ll find this slide incredibly useful if you’re a business analyst presenting customer insights to executives or a marketing lead sharing strategies with your team. It’s designed for various contexts, from boardroom meetings to marketing strategy sessions, particularly in sectors like consumer goods, technology, and services where customer understanding is key.
For only $0.99, you can quickly download this eye-catching slide and customize it in PowerPoint or Google Slides. Prepare to engage and communicate effectively in just a few minutes without any hassle.
$0.99 – Purchase Checkout
Added to cart