Visualize Customer Journey Stages with Funnel Infographic
Product Description
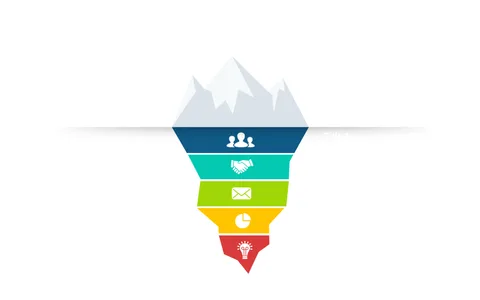
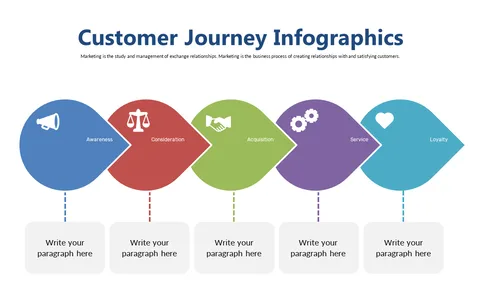
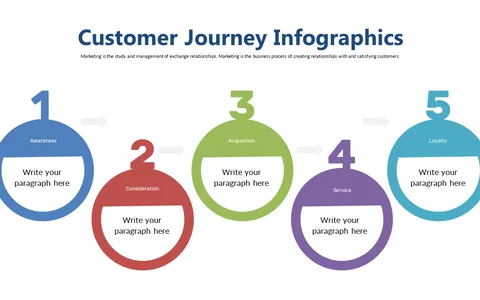
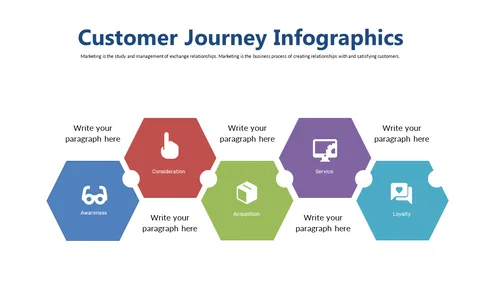
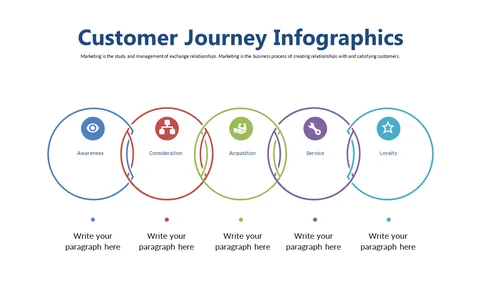
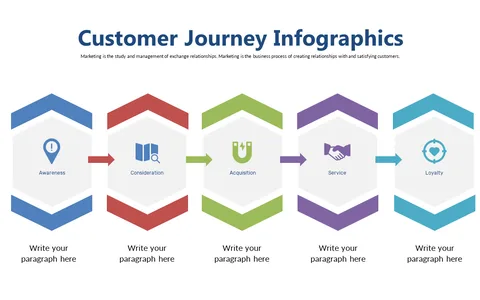
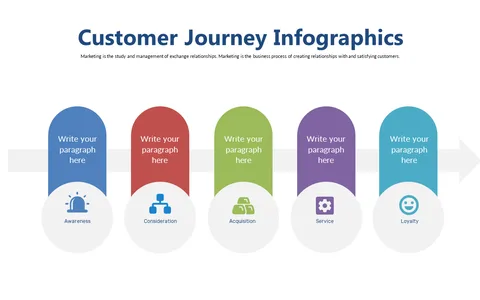
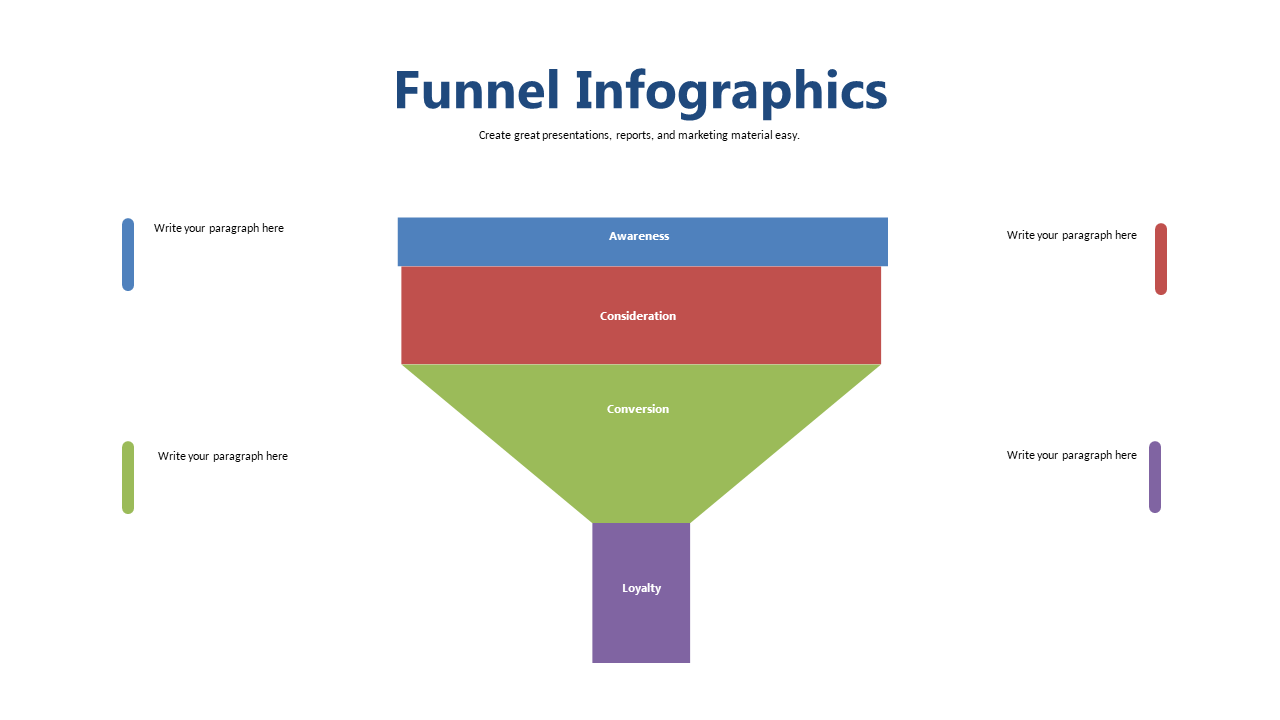
Visualizing the customer journey can be a daunting task, but it doesn’t have to be. This funnel infographic clearly outlines the different stages from Awareness to Loyalty, making complex information easy to digest.
With this visual, you can effectively guide your audience through the customer experience without losing them in details. Marketing analysts, customer experience specialists, and brand managers can leverage this slide during presentations that focus on consumer insights or strategic planning sessions. It’s particularly useful for workshops aimed at improving customer retention and engagement strategies.
You can download this slide right now for just $0.99, and it’s fully editable in both PowerPoint and Google Slides. Make your presentations stand out and resonate with your audience using this simple yet effective visual.
$0.99 – Purchase Checkout
Added to cart