Iceberg Model of Customer Engagement
Product Description
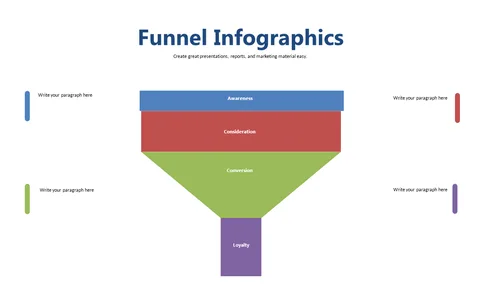
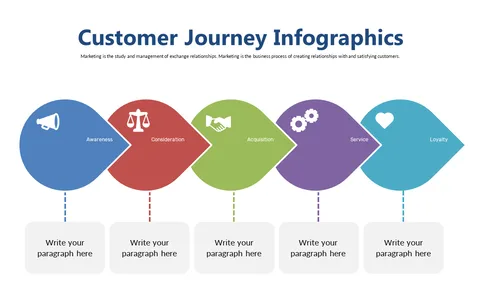
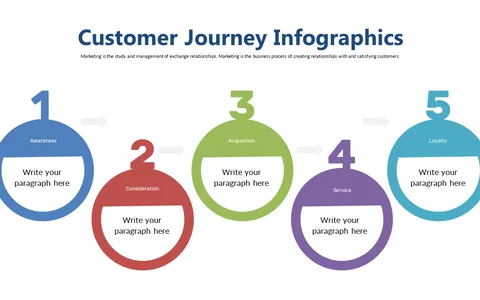
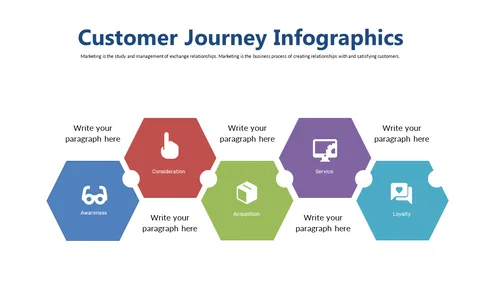
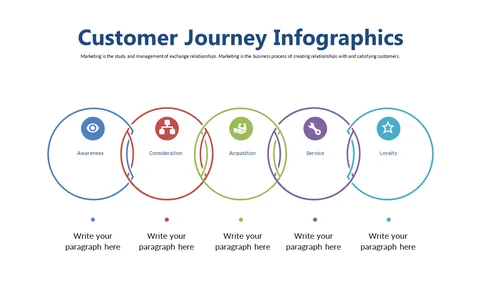
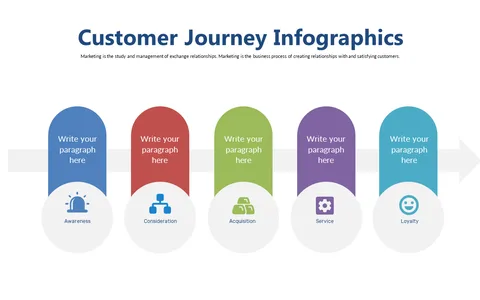
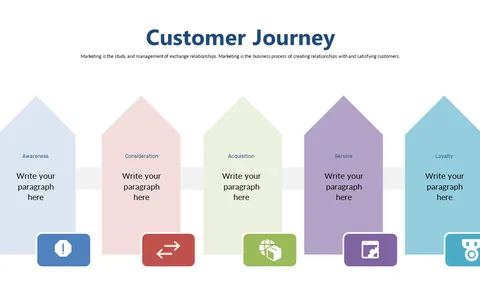
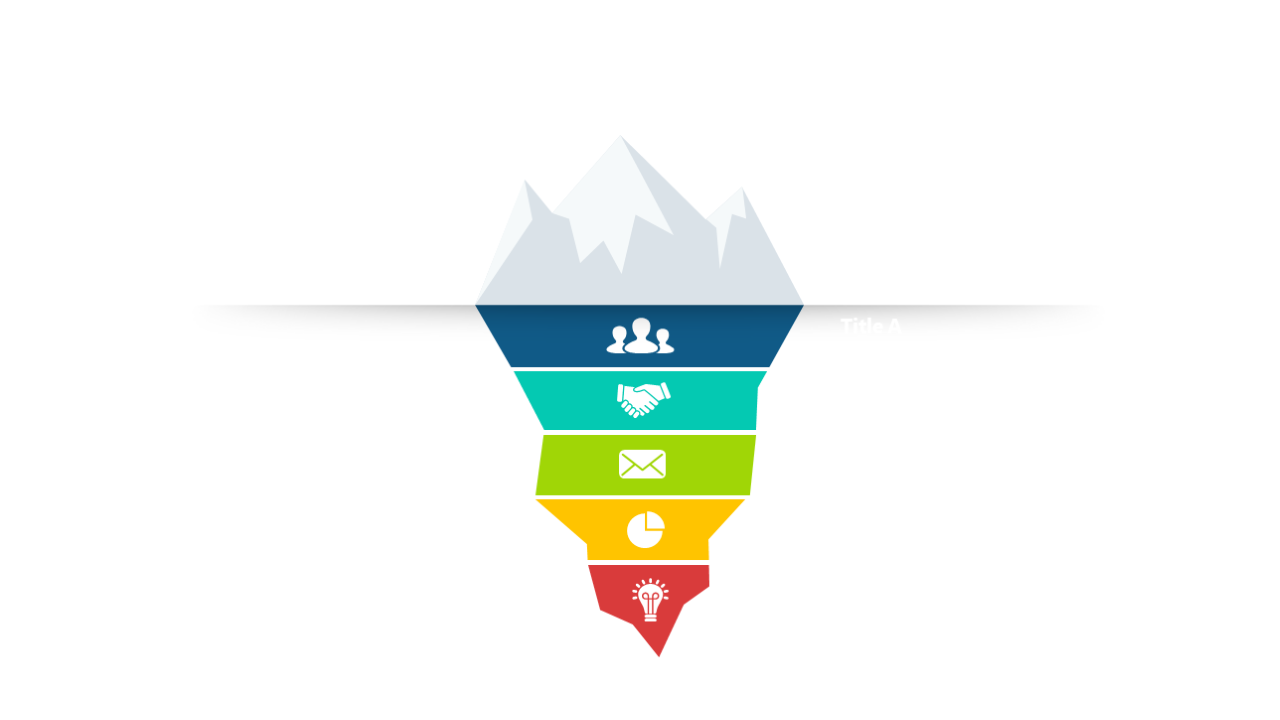
Understanding how customers engage with your brand can be complex, and traditional charts often miss the nuances of interaction. This iceberg model of customer engagement cleverly symbolizes the visible and hidden stages of the customer journey, enabling you to communicate insights in a clear, impactful way. It helps you convey that what lies beneath the surface often holds the key to improved engagement strategies.
Marketing teams and sales professionals can leverage this slide during workshops or presentations focused on customer experience enhancements. It’s particularly effective for discussing the stages of engagement in strategic planning meetings or client pitches, where demonstrating depth and understanding of customer behavior is essential.
With this visual aid, you can set the stage for deeper discussions about customer relations. For only $0.99, you can download this slide and start making it your own in no time. It’s fully editable in PowerPoint and Google Slides, so you can tailor the colors and labels to match your brand’s voice and strategy.
$0.99 – Purchase Checkout
Added to cart