Step-by-Step Customer Journey Visualization
Product Description
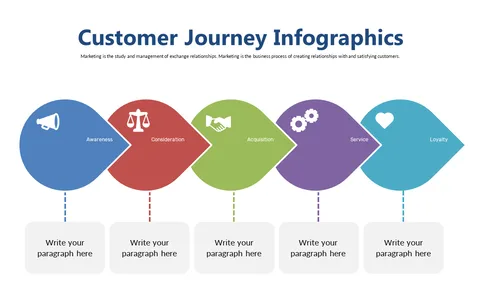
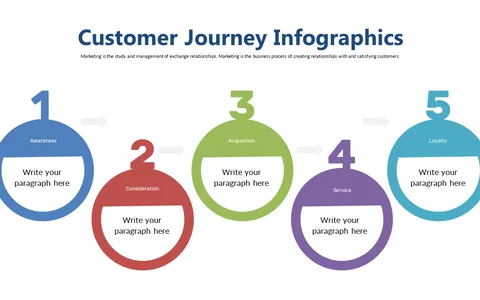
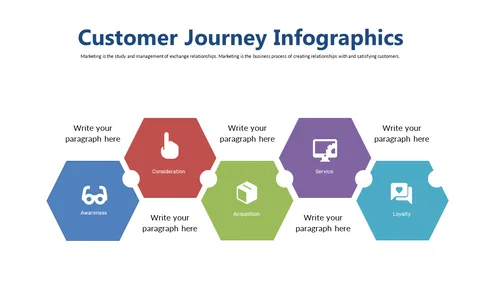
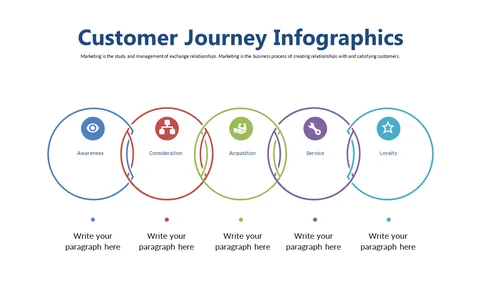
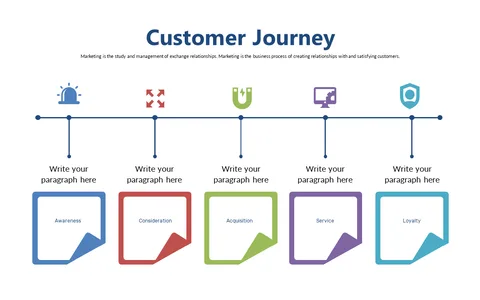
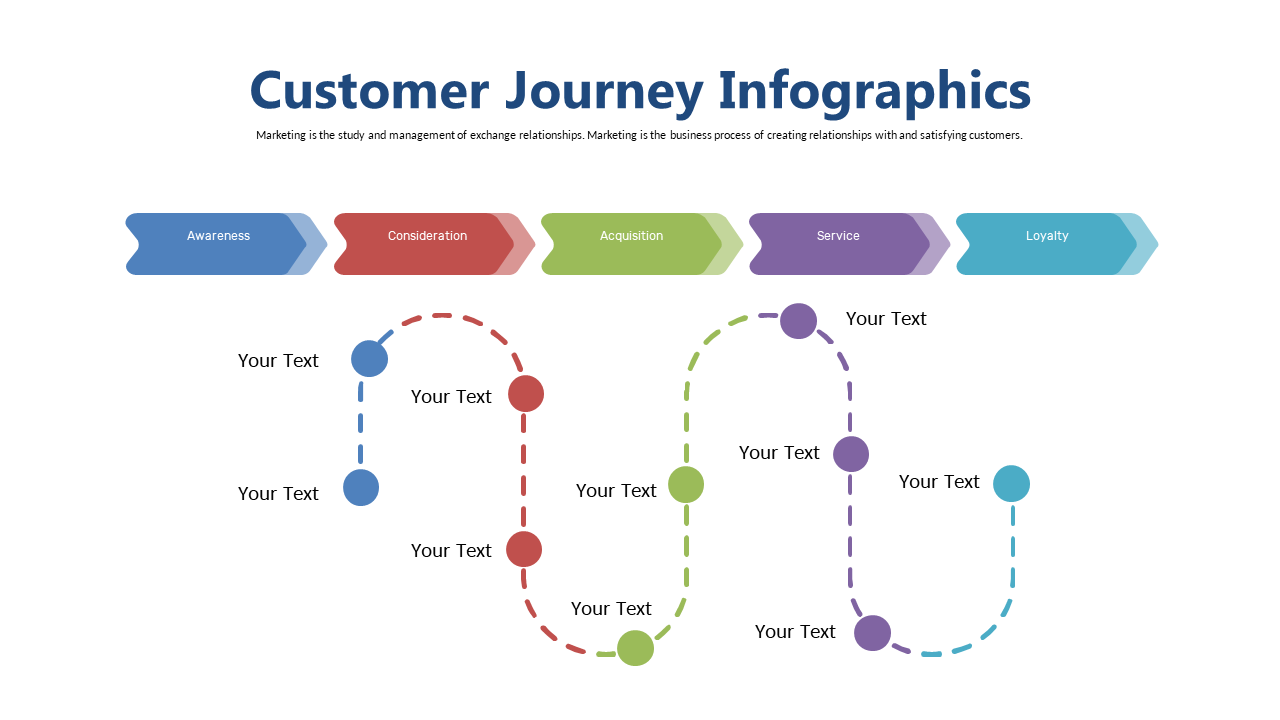
Visualizing the customer journey effectively is critical, yet it can often feel like a challenge. This slide offers a straightforward step-by-step approach to mapping the customer experience, using colored arrows to highlight each stage, from Awareness to Loyalty.
Business analysts and marketing directors will find this slide useful in presentations aimed at data-driven decision-making or during performance reviews to track customer engagement. It’s also great for workshop leaders seeking to teach effective marketing strategies.
For just $0.99, you can download this slide immediately and start editing it in PowerPoint or Google Slides. It’s designed for quick customization, allowing you to prepare your presentation effortlessly.
$0.99 – Purchase Checkout
Added to cart