Visualize Current vs Future States with Circular Sections
Product Description
Effectively illustrating your current position versus your desired future can be a daunting task. When the focus is scattered, key insights can get lost, making it hard for your audience to stay engaged.
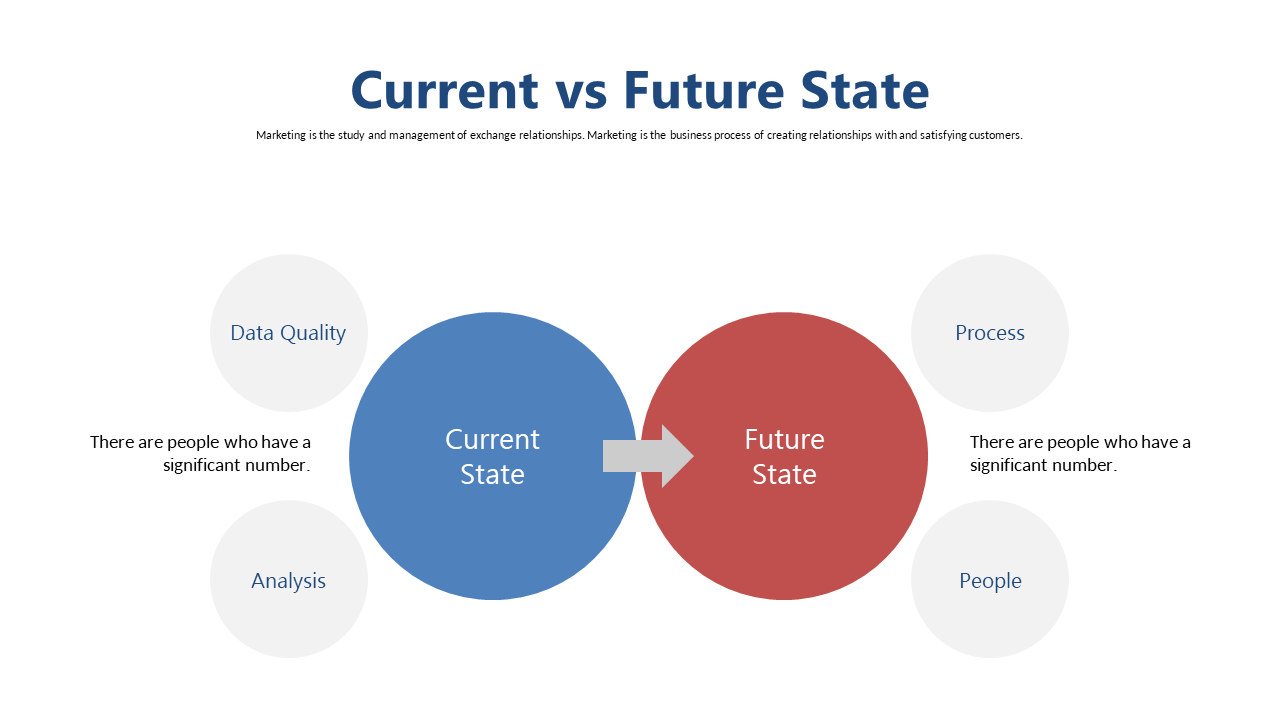
This slide utilizes engaging circular sections to help you present a clear and visually appealing comparison that emphasizes your goals. Ideal for business analysts, marketing strategists, and sales executives, this slide is perfect for workshops, client presentations, or internal strategy discussions. You can use it to showcase the impact of a new marketing initiative or changes to a product line in various industries, helping everyone quickly grasp the vision for the future.
Available for just $0.99, this slide is ready for immediate download and easy to edit in PowerPoint or Google Slides. You can personalize the sections to reflect your unique context in no time at all.
$0.99 – Purchase Checkout
Added to cart







